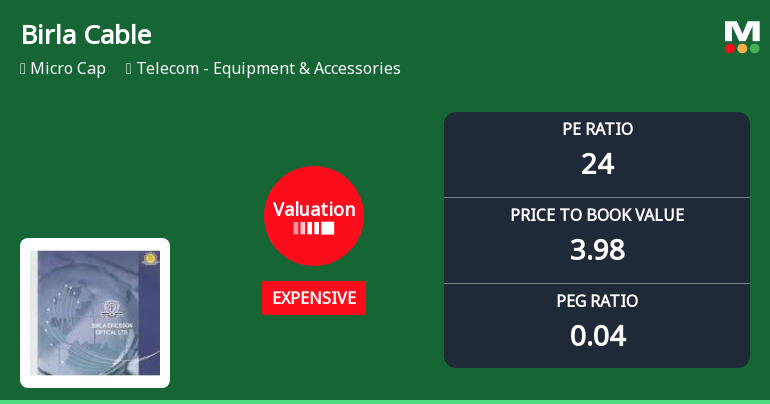
Birla Cable

  • Market Cap: Micro Cap
  • Industry: Telecom - Equipment & Accessories
  • ISIN: INE800A01015
  • NSEID: BIRLACABLE
  • BSEID: 500060
INR
167.52
7.97 (5.0%)
BSENSE

May 25

BSE+NSE Vol: 13.86 k

  • Price Points
  • Score
  • Mojo Parameters
  • Total Return
  • News and Corporate Actions
  • Key factors
  • Shareholding
  • Financials
  • CompanyCV
stock-summaryPrice Point
High/Low

1Day

52 Week

Valuation
Technical
Day's Volume

CASH

13.86 k (-29.85%) Volume

Shareholding (Mar 2026)

FII

0.00%

Held by 0 FIIs

DII

0.01%

Held by 0 DIIs

Promoter

66.35%

Who are in the management team of Birla Cable?

06-Jun-2025

As of March 2022, the management team of Birla Cable includes H V Lodha (Chairman), D R Bansal, Aravind Srinivasan, Arun Kishore, K Raghuraman, Archana Capoor, and B R Nahar, featuring a mix of executive and independent non-executive directors.

As of March 2022, the management team of Birla Cable includes the following individuals:<BR><BR>1. H V Lodha - Chairman (Non-Executive) & Director (Non-Independent)<BR>2. D R Bansal - Non-Executive & Non-Independent Director<BR>3. Aravind Srinivasan - Independent Non-Executive Director<BR>4. Arun Kishore - Independent Non-Executive Director<BR>5. K Raghuraman - Independent Non-Executive Director<BR>6. Archana Capoor - Independent Non-Executive Director<BR>7. B R Nahar - Non-Executive & Non-Independent Director<BR><BR>This team comprises a mix of executive and non-executive directors, with a focus on independent oversight.

View full answer

What does Birla Cable do?

06-Jun-2025

Birla Cable Ltd manufactures optical fibre and Jelly Filled Telephone Cables, operating in the Telecom industry as a micro-cap company. As of March 2025, it reported net sales of ₹156 Cr and a net profit of ₹1 Cr, with a market cap of ₹543 Cr.

Overview:<BR>Birla Cable Ltd is engaged in the manufacture of optical fibre cables and Jelly Filled Telephone Cables, operating within the Telecom - Equipment & Accessories industry and classified as a micro-cap company.<BR><BR>History:<BR>Birla Cable Limited was incorporated on June 30, 1992, originally as Birla Ericsson Optical Limited. The latest quarterly results reported net sales and profit for the period ending March 2025.<BR><BR>Financial Snapshot:<BR>- Net Sales: 156 Cr (Quarterly Results - Mar 2025)<BR>- Net Profit: 1 Cr (Quarterly Results - Mar 2025)<BR>- Market Cap: Rs 543 Cr (Micro Cap)<BR><BR>Key Metrics:<BR>- P/E: 112.00<BR>- Industry P/E: 46<BR>- Dividend Yield: 0.94%<BR>- Debt Equity: 0.51<BR>- Return on Equity: 2.80%<BR>- Price to Book: 2.08<BR><BR>Contact Details:<BR>- Address: Udyog Vihar, P O Chorhata Rewa Madhya Pradesh : 486006<BR>- Tel: 91-7662-400580<BR>- Email: headoffice@birlaericsson.com<BR>- Website: http://www.birlacable.com

View full answer

Has Birla Cable declared dividend?

06-Jun-2025

Yes, Birla Cable Ltd has declared a 17% dividend, amounting to ₹1.7 per share, with an ex-date of July 26, 2024. While recent price returns have been negative, the dividend has positively impacted total returns over longer periods.

Birla Cable Ltd has declared a 17% dividend.<BR><BR>Dividend Details:<BR>- Percentage announced: 17%<BR>- Amount per share: 1.7<BR>- Ex-date: 26 Jul 24<BR><BR>Dividend Yield: 0.94%.<BR><BR>Total Returns by Period:<BR>In the last 6 months, the price return was -20.89%, with a dividend return of 0%, resulting in a total return of -20.89%.<BR><BR>Over the past year, the price return was -22.36%, the dividend return was 0.67%, leading to a total return of -21.69%.<BR><BR>In the 2-year period, the price return was -2.55%, with a dividend return of 2.41%, resulting in a total return of -0.14%.<BR><BR>For the 3-year period, the price return was 50.23%, the dividend return was 5.52%, culminating in a total return of 55.75%.<BR><BR>In the last 4 years, the price return was 142.51%, with a dividend return of 5.95%, leading to a total return of 148.46%.<BR><BR>Over the 5-year period, the price return was 289.69%, the dividend return was 13.00%, resulting in a total return of 302.69%.<BR><BR>Overall, Birla Cable has declared a dividend, which has contributed positively to total returns over longer periods, particularly in the 3, 4, and 5-year spans, despite recent negative price returns in shorter time frames.

View full answer

Who are the peers of the Birla Cable?

03-Jun-2025

Birla Cable's peers include Indus Towers, ITI, HFCL, Tejas Networks, Optiemus Infra, Valiant Commun., ADC India, Kavveri Defence, and Kore Digital. In terms of management risk, growth, and capital structure, Birla Cable shows average performance, with a 1-year return of -19.94%.

Peers: The peers of Birla Cable are Indus Towers, ITI, HFCL, Tejas Networks, Optiemus Infra, Valiant Commun., ADC India, Kavveri Defence, and Kore Digital.<BR><BR>Quality Snapshot: Excellent management risk is observed at Indus Towers and Kore Digital, while Good management risk is found at HFCL. Average management risk is present at Tejas Networks, Optiemus Infra, Birla Cable, Valiant Commun., and ADC India, while Below Average management risk is noted at ITI and Kavveri Defence. For Growth, Excellent growth is seen at Indus Towers and Tejas Networks, while Good growth is observed at HFCL, Optiemus Infra, Valiant Commun., and ADC India. Average growth is found at Birla Cable and Kavveri Defence, and Below Average growth is noted at ITI and Tejas Networks. In terms of Capital Structure, Excellent capital structure is present at ADC India, Good capital structure is observed at HFCL, Valiant Commun., and Kore Digital, while Average capital structure is found at Indus Towers and Tejas Networks. Below Average capital structure is noted at Birla Cable, ITI, and Kavveri Defence.<BR><BR>Return Snapshot: The peer with the highest 1-year return is Kavveri Defence at 259.68%, while the lowest is HFCL at -15.21%. Birla Cable's 1-year return is -19.94%, which is lower than HFCL's. Additionally, peers with negative six-month returns include HFCL, Tejas Networks, ADC India, and Birla Cable.

View full answer

Who are the top shareholders of the Birla Cable?

17-Jul-2025

The top shareholders of Birla Cable include Vindhya Telelinks Limited with a 19.33% stake, individual investors owning 27.88%, and three foreign institutional investors holding 0.13%. There are currently no mutual funds or significant public shareholders invested in the company.

The top shareholders of Birla Cable primarily include its promoters, with Vindhya Telelinks Limited holding the highest stake at 19.33%. Additionally, individual investors collectively own 27.88% of the company. There are also three foreign institutional investors (FIIs) that hold a small portion, accounting for 0.13%. It's worth noting that there are no mutual funds currently invested in Birla Cable, and there are no significant public shareholders listed.

View full answer

How big is Birla Cable?

24-Jul-2025

As of 24th July, Birla Cable Ltd has a market capitalization of 524.00 Cr, with net sales of 661.66 Cr and a net profit of 4.88 Cr reported in the latest four quarters. Shareholder's funds are 251.00 Cr, and total assets amount to 458.07 Cr as of March 2024.

As of 24th July, Birla Cable Ltd has a market capitalization of 524.00 Cr, categorizing it as a Micro Cap company.<BR><BR>In the latest four quarters, Birla Cable reported net sales of 661.66 Cr and a net profit of 4.88 Cr.<BR><BR>The latest annual period for the balance sheet is March 2024, with shareholder's funds amounting to 251.00 Cr and total assets of 458.07 Cr.

View full answer

Is Birla Cable technically bullish or bearish?

30-Oct-2025

As of October 29, 2025, the technical trend is mildly bearish due to daily moving averages and KST signals, despite some mixed indicators from the weekly MACD and Bollinger Bands, with the stock showing strong weekly performance but significant negative returns year-to-date and over the past year.

As of 29 October 2025, the technical trend has changed from bearish to mildly bearish. The current stance is mildly bearish, driven primarily by the daily moving averages indicating a bearish outlook and the KST showing bearish signals on both weekly and monthly time frames. While the weekly MACD is mildly bullish and the Bollinger Bands are bullish on the weekly chart, the overall sentiment remains cautious due to the monthly bearish indicators. The Dow Theory presents a mixed view with a mildly bearish weekly stance and a mildly bullish monthly stance. The stock's recent performance shows a strong weekly return compared to the Sensex, but the year-to-date and one-year returns are significantly negative, indicating underlying weakness.

View full answer

How has been the historical performance of Birla Cable?

06-Nov-2025

Birla Cable has experienced a declining trend in net sales and profits over the past three fiscal years, with net sales dropping from 792.20 crore in March 2023 to 661.65 crore in March 2025, and profit after tax falling from 32.94 crore to 4.89 crore. However, cash flow from operating activities improved significantly from -7.00 crore to 112.00 crore during the same period.

Answer:<BR>The historical performance of Birla Cable shows a declining trend in net sales and profits over the past three fiscal years.<BR><BR>Breakdown:<BR>Birla Cable's net sales decreased from 792.20 crore in March 2023 to 685.50 crore in March 2024, and further to 661.65 crore in March 2025. Total operating income followed a similar trend, dropping from 792.20 crore in March 2023 to 661.65 crore in March 2025. The company's total expenditure, excluding depreciation, also declined from 729.20 crore in March 2023 to 628.96 crore in March 2025. Operating profit (PBDIT) decreased significantly from 67.51 crore in March 2023 to 35.79 crore in March 2025, while profit before tax fell from 43.97 crore to 6.68 crore in the same period. Consequently, profit after tax dropped from 32.94 crore in March 2023 to 4.89 crore in March 2025. The earnings per share (EPS) reflected this decline, falling from 10.98 in March 2023 to 1.63 in March 2025. On the balance sheet, total liabilities decreased from 460.73 crore in March 2023 to 416.06 crore in March 2025, while total assets also fell from 460.73 crore to 416.06 crore. Cash flow from operating activities improved from -7.00 crore in March 2023 to 112.00 crore in March 2025, indicating a positive shift in operational cash flow despite the overall decline in profitability.

View full answer

Is Birla Cable overvalued or undervalued?

20-Nov-2025

As of November 19, 2025, Birla Cable is considered very attractive and undervalued with a PE ratio of 88.86 and an EV to EBITDA of 17.20, significantly lower than peers like Polycab India and Havells India, despite a year-to-date stock performance of -30.98% compared to the Sensex's 9.02%.

As of 19 November 2025, the valuation grade for Birla Cable has moved from attractive to very attractive. The company is currently assessed as undervalued. Key ratios include a PE ratio of 88.86, an EV to EBITDA of 17.20, and a Price to Book Value of 1.64. <BR><BR>In comparison to peers, Polycab India has a PE of 46.93 and an EV to EBITDA of 31.17, while Havells India shows a PE of 61.8 and an EV to EBITDA of 41.74, indicating that Birla Cable's valuation is significantly lower than these competitors. Despite recent stock performance trailing the Sensex, with a year-to-date return of -30.98% compared to the Sensex's 9.02%, the underlying valuation metrics suggest that Birla Cable presents a compelling investment opportunity at its current price of 147.80.

View full answer

When is the next results date for Birla Cable Ltd?

12-May-2026

The next results date for Birla Cable Ltd is 22 May 2026.

The next results date for Birla Cable Ltd is scheduled for 22 May 2026.

View full answer

Are Birla Cable Ltd latest results good or bad?

23-May-2026

Birla Cable Ltd's latest Q4 FY26 results are positive, with a 629.73% increase in net profit and a 37.04% rise in revenue. However, the stock has declined 7.61% over the past year, indicating ongoing operational challenges that may affect long-term prospects.

Birla Cable Ltd's latest results for Q4 FY26 show a significant improvement, indicating a positive shift in performance. The company reported a net profit of ₹10.80 crore, which represents a remarkable increase of 629.73% year-on-year. Revenue also saw a substantial rise, reaching ₹214.10 crore, up 37.04% from the previous year. Additionally, the operating margin improved to 9.46%, marking the highest level in seven quarters.<BR><BR>However, while these quarterly results are impressive, they come against a backdrop of a challenging year for the company. Over the past twelve months, Birla Cable's stock has declined by 7.61%, underperforming its sector, which has seen a 12.61% return during the same period. This raises concerns about the sustainability of the recent improvements, as the company has struggled with declining sales growth and profitability over the longer term.<BR><BR>In summary, the latest quarterly results are good, showcasing strong growth and improved margins. Yet, the overall context suggests that investors should remain cautious, as the company faces ongoing operational challenges and questions about its long-term prospects.

View full answer

Should I buy, sell or hold Birla Cable Ltd?

23-May-2026

Why is Birla Cable Ltd falling/rising?

24-May-2026

As of 24-May, Birla Cable Ltd's stock price is rising to Rs 160.20, reflecting a 4.5% increase after two days of decline and outperforming its sector. Despite longer-term declines, the stock shows strong year-to-date performance and increased investor interest.

As of 24-May, Birla Cable Ltd's stock price is rising, currently at Rs 160.20, which reflects an increase of Rs 6.9 or 4.5%. This upward movement follows a trend reversal, as the stock has gained after two consecutive days of decline. Additionally, the stock has outperformed its sector by 4.38% today, indicating strong relative performance.<BR><BR>The stock reached an intraday high of Rs 160.95, showcasing significant intraday momentum. Furthermore, there has been a notable increase in investor participation, with delivery volume rising by 42.14% compared to the 5-day average, suggesting heightened interest from investors. <BR><BR>Despite some negative trends over longer periods, such as a decline of 7.61% over the past year and a 10.48% drop over three years, the year-to-date performance is strong, with a gain of 17.23%. The stock's current price is also above its 5-day, 50-day, 100-day, and 200-day moving averages, although it is lower than the 20-day moving average, indicating a mixed but generally positive trend in the short term. Overall, these factors contribute to the stock's rising price.

View full answer
iScoreScore
Click here to find our call on this stock
Strong Sell
Sell
Hold
Buy
Strong Buy

Dashboard

1

Weak Long Term Fundamental Strength with a -37.18% CAGR growth in Operating Profits over the last 5 years

  • Low ability to service debt as the company has a high Debt to EBITDA ratio of 3.49 times
  • The company has been able to generate a Return on Equity (avg) of 6.63% signifying low profitability per unit of shareholders funds
2

With a growth in Net Profit of 629.73%, the company declared Very Positive results in Mar 26

3

With ROCE of 4.2, it has a Attractive valuation with a 1.6 Enterprise value to Capital Employed

4

Majority shareholders : Promoters

 
5

Consistent Underperformance against the benchmark over the last 3 years

stock-summaryMojo Parameters

Mojo Parameters

Loading Valuation Snapshot...

Stock DNA

stock-summary
Industry

Telecom - Equipment & Accessories

stock-summary
Market cap

INR 503 Cr (Micro Cap)

stock-summary
P/E

64.00

stock-summary
Industry P/E

47

stock-summary
Dividend Yield

0.00%

stock-summary
Debt Equity

0.41

stock-summary
Return on Equity

1.85%

stock-summary
Price to Book

1.79

Revenue and Profits:
Net Sales:
214 Cr
(Quarterly Results - Mar 2026)
Net Profit:
11 Cr
stock-summaryTotal Returns
Total Returns (Price + Dividend) stock-summary
Dividend Yield (0%)
TimePeriod
Price Return
Dividend Return
Total Return
3 Months
20.9%
0%
20.9%
6 Months
15.53%
0%
15.53%
1 Year
-12.55%
0%
-12.55%
2 Years
-30.76%
0.80%
-29.96%
3 Years
-7.42%
2.31%
-5.11%
4 Years
37.82%
5.19%
43.01%
5 Years
127.45%
6.24%
133.69%

Latest dividend: 1.7 per share ex-dividend date: Jul-26-2024

Risk Adjusted Returns v/s stock-summary
Returns Beta
Icon
Beta has not been calculated since enough price history is not available
stock-summaryNews & Corporate Actions

News

Birla Cable Ltd’s Volatile Week: -0.12% Price Change Amid Circuit Hits and Valuation Shifts

Announcements stock-summary

Birla Cable Limited - Updates

26-Nov-2019 | Source : NSE

Birla Cable Limited has informed the Exchange regarding 'Newspaper Advertisement- Transfer of Shares in Physical mode in terms of SEBI Circular No. SEBI/HO/MIRSD/DOS3/CIR/P2018/139 dated November 6,2018'.

Birla Cable Limited - Updates

13-Nov-2019 | Source : NSE

Birla Cable Limited has informed the Exchange regarding 'Newspaper Advertisment -Unaudited Financial Results for the quarter and half year ended 30th September,2019'.

Birla Cable Limited - Updates

01-Nov-2019 | Source : NSE

Birla Cable Limited has informed the Exchange regarding 'Newspaper Advertisement'.

Corporate Actions stock-summary

stock-summary
BOARD MEETING

No Upcoming Board Meetings

stock-summary
DIVIDEND

Birla Cable Ltd has declared 17% dividend, ex-date: 26 Jul 24

stock-summary
SPLITS

No Splits history available

stock-summary
BONUS

No Bonus history available

stock-summary
RIGHTS

No Rights history available

stock-summaryKey Factors

Quality key factors stock-summary

Factor
Value
Sales Growth (5y)
-2.87%
EBIT Growth (5y)
-37.18%
EBIT to Interest (avg)
2.04
Debt to EBITDA (avg)
3.58
Net Debt to Equity (avg)
0.41
Sales to Capital Employed (avg)
1.73
Tax Ratio
26.97%
Dividend Payout Ratio
107.33%
Pledged Shares
6.28%
Institutional Holding
0.01%
ROCE (avg)
7.86%
ROE (avg)
6.63%

Valuation key factors

Factor
Value
P/E Ratio
64
Industry P/E
47
Price to Book Value
1.78
EV to EBIT
33.38
EV to EBITDA
17.40
EV to Capital Employed
1.56
EV to Sales
0.83
PEG Ratio
1.23
Dividend Yield
NA
ROCE (Latest)
4.18%
ROE (Latest)
1.85%

Technicals key factors

Indicator
Weekly
Monthly
MACD
Bullish
Bearish
RSI
No Signal
No Signal
Bollinger Bands
Bullish
Mildly Bearish
Moving Averages
Mildly Bearish (Daily)
KST
Bullish
Mildly Bullish
Dow Theory
Mildly Bullish
Mildly Bullish
OBV
Bullish
Bullish
stock-summary Technical Indicator Scale: Bearish, Mildly Bearish, Sideways, Mildly Bullish, Bullish  Turned 
stock-summaryShareholding
Shareholding Snapshot : Mar 2026stock-summary
Shareholding Compare (%holding) stock-summary
Majority shareholders

Promoters

Pledged Promoter Holdings

6.2796

Mutual Funds

Held by 0 Schemes

FIIs

Held by 0 FIIs

Promoter with highest holding

Vindhya Telelinks Limited (19.33%)

Highest Public shareholder

None

Individual Investors Holdings

27.69%

stock-summaryFinancial
[
  {
    "link": "quarterly",
    "btn_text": "All Quarterly Results",
    "header": "Quarterly Results Snapshot (Consolidated) - Mar'26 - YoY",
    "rhs": [
      {
        "prefix": "Net Sales ",
        "suffix": "YoY Growth in quarter ended Mar 2026 is 37.04% vs -10.58% in Mar 2025",
        "dir": 1
      },
      {
        "prefix": "Consolidated Net Profit ",
        "suffix": "YoY Growth in quarter ended Mar 2026 is 629.73% vs -6.92% in Mar 2025",
        "dir": 1
      }
    ],
    "table": {
      "header": [
        "Mar'26",
        "Mar'25",
        "Change(%)"
      ],
      "body": [
        {
          "field": "Net Sales",
          "val1": "214.10",
          "val2": "156.23",
          "chgp": "37.04%",
          "chgp_class": "positive"
        },
        {
          "field": "Operating Profit (PBDIT) excl Other Income",
          "val1": "20.25",
          "val2": "7.93",
          "chgp": "155.36%",
          "chgp_class": "positive"
        },
        {
          "field": "Interest",
          "val1": "3.59",
          "val2": "2.85",
          "chgp": "25.96%",
          "chgp_class": "negative"
        },
        {
          "field": "Exceptional Items",
          "val1": "0.00",
          "val2": "0.00",
          "chgp": "",
          "chgp_class": "neutral"
        },
        {
          "field": "Consolidate Net Profit",
          "val1": "10.80",
          "val2": "1.48",
          "chgp": "629.73%",
          "chgp_class": "positive"
        },
        {
          "field": "Operating Profit Margin (Excl OI)",
          "val1": "9.46%",
          "val2": "5.08%",
          "chgp": "4.38%",
          "chgp_class": "positive"
        }
      ]
    }
  },
  {
    "link": "half-yearly",
    "btn_text": "All Half Yearly Results",
    "header": "Half Yearly Results Snapshot (Consolidated) - Sep'25",
    "rhs": [
      {
        "prefix": "Net Sales ",
        "suffix": "Not Applicable: The company has declared_date for only one period",
        "dir": 0
      },
      {
        "prefix": "Consolidated Net Profit ",
        "suffix": "Not Applicable: The company has declared_date for only one period",
        "dir": 0
      }
    ],
    "table": {
      "header": [
        "Sep'25",
        "Sep'24",
        "Change(%)"
      ],
      "body": [
        {
          "field": "Net Sales",
          "val1": "352.50",
          "val2": "347.62",
          "chgp": "1.40%",
          "chgp_class": "positive"
        },
        {
          "field": "Operating Profit (PBDIT) excl Other Income",
          "val1": "15.07",
          "val2": "15.69",
          "chgp": "-3.95%",
          "chgp_class": "negative"
        },
        {
          "field": "Interest",
          "val1": "4.91",
          "val2": "6.92",
          "chgp": "-29.05%",
          "chgp_class": "positive"
        },
        {
          "field": "Exceptional Items",
          "val1": "0.00",
          "val2": "0.00",
          "chgp": "",
          "chgp_class": "neutral"
        },
        {
          "field": "Consolidate Net Profit",
          "val1": "2.07",
          "val2": "2.03",
          "chgp": "1.97%",
          "chgp_class": "positive"
        },
        {
          "field": "Operating Profit Margin (Excl OI)",
          "val1": "4.28%",
          "val2": "4.51%",
          "chgp": "-0.23%",
          "chgp_class": "negative"
        }
      ]
    }
  },
  {
    "link": "nine-monthly",
    "btn_text": "All Nine Monthly Results",
    "header": "Nine Monthly Results Snapshot (Consolidated) - Dec'25",
    "rhs": [
      {
        "prefix": "Net Sales ",
        "suffix": "YoY Growth in nine months ended Dec 2025 is 10.21% vs -1.05% in Dec 2024",
        "dir": 1
      },
      {
        "prefix": "Consolidated Net Profit ",
        "suffix": "YoY Growth in nine months ended Dec 2025 is 75.50% vs -83.11% in Dec 2024",
        "dir": 1
      }
    ],
    "table": {
      "header": [
        "Dec'25",
        "Dec'24",
        "Change(%)"
      ],
      "body": [
        {
          "field": "Net Sales",
          "val1": "557.01",
          "val2": "505.42",
          "chgp": "10.21%",
          "chgp_class": "positive"
        },
        {
          "field": "Operating Profit (PBDIT) excl Other Income",
          "val1": "25.96",
          "val2": "24.81",
          "chgp": "4.64%",
          "chgp_class": "positive"
        },
        {
          "field": "Interest",
          "val1": "7.63",
          "val2": "10.86",
          "chgp": "-29.74%",
          "chgp_class": "positive"
        },
        {
          "field": "Exceptional Items",
          "val1": "0.00",
          "val2": "0.00",
          "chgp": "",
          "chgp_class": "neutral"
        },
        {
          "field": "Consolidate Net Profit",
          "val1": "6.09",
          "val2": "3.47",
          "chgp": "75.50%",
          "chgp_class": "positive"
        },
        {
          "field": "Operating Profit Margin (Excl OI)",
          "val1": "4.66%",
          "val2": "4.91%",
          "chgp": "-0.25%",
          "chgp_class": "negative"
        }
      ]
    }
  },
  {
    "link": "annual",
    "btn_text": "All Annual Results",
    "header": "Annual Results Snapshot (Consolidated) - Mar'26",
    "rhs": [
      {
        "prefix": "Net Sales ",
        "suffix": "YoY Growth in year ended Mar 2026 is 16.54% vs -3.48% in Mar 2025",
        "dir": 1
      },
      {
        "prefix": "Consolidated Net Profit ",
        "suffix": "YoY Growth in year ended Mar 2026 is 245.60% vs -77.91% in Mar 2025",
        "dir": 1
      }
    ],
    "table": {
      "header": [
        "Mar'26",
        "Mar'25",
        "Change(%)"
      ],
      "body": [
        {
          "field": "Net Sales",
          "val1": "771.11",
          "val2": "661.65",
          "chgp": "16.54%",
          "chgp_class": "positive"
        },
        {
          "field": "Operating Profit (PBDIT) excl Other Income",
          "val1": "46.97",
          "val2": "32.69",
          "chgp": "43.68%",
          "chgp_class": "positive"
        },
        {
          "field": "Interest",
          "val1": "12.34",
          "val2": "13.72",
          "chgp": "-10.06%",
          "chgp_class": "positive"
        },
        {
          "field": "Exceptional Items",
          "val1": "0.00",
          "val2": "0.00",
          "chgp": "",
          "chgp_class": "neutral"
        },
        {
          "field": "Consolidate Net Profit",
          "val1": "16.90",
          "val2": "4.89",
          "chgp": "245.60%",
          "chgp_class": "positive"
        },
        {
          "field": "Operating Profit Margin (Excl OI)",
          "val1": "6.09%",
          "val2": "4.94%",
          "chgp": "1.15%",
          "chgp_class": "positive"
        }
      ]
    }
  }
]

Quarterly Results Snapshot (Consolidated) - Mar'26 - YoYstock-summary

Mar'26
Mar'25
Change(%)
Net Sales
214.10
156.23
37.04%
Operating Profit (PBDIT) excl Other Income
20.25
7.93
155.36%
Interest
3.59
2.85
25.96%
Exceptional Items
0.00
0.00
Consolidate Net Profit
10.80
1.48
629.73%
Operating Profit Margin (Excl OI)
9.46%
5.08%
4.38%
Values in Rs Cr.
Direction Arrows
Net Sales

YoY Growth in quarter ended Mar 2026 is 37.04% vs -10.58% in Mar 2025

Direction Arrows
Consolidated Net Profit

YoY Growth in quarter ended Mar 2026 is 629.73% vs -6.92% in Mar 2025

Half Yearly Results Snapshot (Consolidated) - Sep'25stock-summary

Sep'25
Sep'24
Change(%)
Net Sales
352.50
347.62
1.40%
Operating Profit (PBDIT) excl Other Income
15.07
15.69
-3.95%
Interest
4.91
6.92
-29.05%
Exceptional Items
0.00
0.00
Consolidate Net Profit
2.07
2.03
1.97%
Operating Profit Margin (Excl OI)
4.28%
4.51%
-0.23%
Values in Rs Cr.
Net Sales

Not Applicable: The company has declared_date for only one period

Consolidated Net Profit

Not Applicable: The company has declared_date for only one period

Nine Monthly Results Snapshot (Consolidated) - Dec'25stock-summary

Dec'25
Dec'24
Change(%)
Net Sales
557.01
505.42
10.21%
Operating Profit (PBDIT) excl Other Income
25.96
24.81
4.64%
Interest
7.63
10.86
-29.74%
Exceptional Items
0.00
0.00
Consolidate Net Profit
6.09
3.47
75.50%
Operating Profit Margin (Excl OI)
4.66%
4.91%
-0.25%
Values in Rs Cr.
Direction Arrows
Net Sales

YoY Growth in nine months ended Dec 2025 is 10.21% vs -1.05% in Dec 2024

Direction Arrows
Consolidated Net Profit

YoY Growth in nine months ended Dec 2025 is 75.50% vs -83.11% in Dec 2024

Annual Results Snapshot (Consolidated) - Mar'26stock-summary

Mar'26
Mar'25
Change(%)
Net Sales
771.11
661.65
16.54%
Operating Profit (PBDIT) excl Other Income
46.97
32.69
43.68%
Interest
12.34
13.72
-10.06%
Exceptional Items
0.00
0.00
Consolidate Net Profit
16.90
4.89
245.60%
Operating Profit Margin (Excl OI)
6.09%
4.94%
1.15%
Values in Rs Cr.
Direction Arrows
Net Sales

YoY Growth in year ended Mar 2026 is 16.54% vs -3.48% in Mar 2025

Direction Arrows
Consolidated Net Profit

YoY Growth in year ended Mar 2026 is 245.60% vs -77.91% in Mar 2025

stock-summaryCompany CV
About Birla Cable Ltd stock-summary
stock-summary
Birla Cable Ltd
Micro Cap
Telecom - Equipment & Accessories
Birla Cable Limited was formerly incorporated as Birla Ericsson Optical Limited on June 30, 1992 and was promoted by Priyamvada Buta, Universal Cables, Vindhya Telelinks and Ericsson Cables, Sweden (30% stake). The name of the Company was thereafter changed from 'Birla Ericsson Optical Limited' to 'Birla Cable Limited' w.e.f. August 29, 2016. The company is engaged in the manufacture and sale of optical fibre cables and Jelly Filled Telephone Cables.
Company Coordinates stock-summary
Company Details
Udyog Vihar, P O Chorhata Rewa Madhya Pradesh : 486006
stock-summary
Tel: 91-7662-400580
stock-summary
headoffice@birlaericsson.com
Registrar Details
Link Intime India Pvt Ltd, C-13 Pannalal Silk Compound, L B S Marg, Bhandup , Mumbai