
Compare FCS Software with Similar Stocks
Dashboard
Company has a Debt to Equity ratio (avg) of 0.02 times
Poor long term growth as Net Sales has grown by an annual rate of 11.29% and Operating profit at 8.01% over the last 5 years
With a growth in Net Profit of 53900%, the company declared Outstanding results in Mar 26
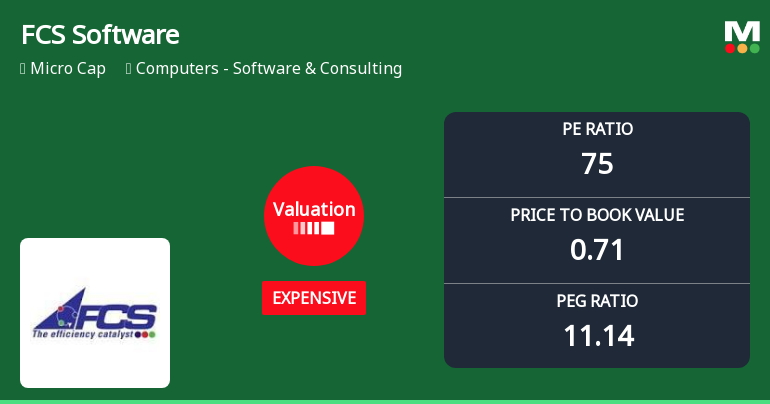
With ROE of 1, it has a Expensive valuation with a 0.7 Price to Book Value
Majority shareholders : Non Institution
Underperformed the market in the last 1 year
Stock DNA
Computers - Software & Consulting
INR Cr (Micro Cap)
75.00
20
0.00%
0.00
0.00%
0.00
Total Returns (Price + Dividend) 
Latest dividend: 0.5 per share ex-dividend date: Sep-03-2009
Risk Adjusted Returns v/s
Returns Beta

News
FCS Software Solutions Ltd Valuation Shifts Signal Mixed Investor Sentiment
FCS Software Solutions Ltd has experienced a notable shift in its valuation parameters, moving from a very expensive to an expensive rating, reflecting a nuanced change in price attractiveness. Despite a modest recent decline in share price, the company’s elevated price-to-earnings (P/E) and price-to-book value (P/BV) ratios relative to peers and historical averages warrant a closer examination for investors seeking clarity on its market positioning.
Read full news article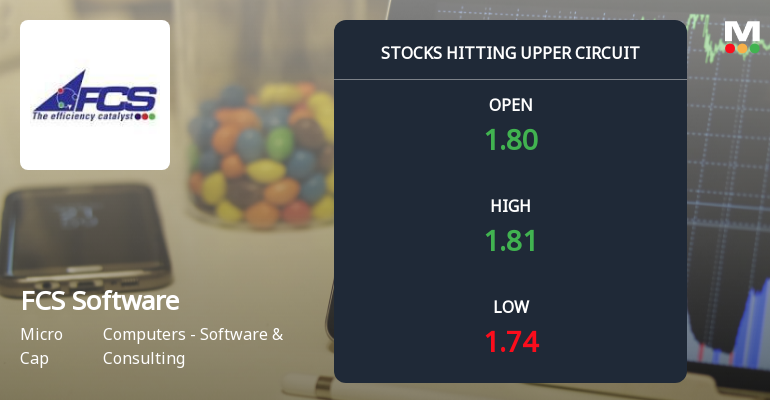
FCS Software Solutions Ltd Locks at Upper Circuit With 4.65% Gain — Buyers Queue, Sellers Absent
At Rs 1.80, the buying was done — not because demand dried up, but because the exchange wouldn't let the stock go any higher. FCS Software Solutions Ltd locked at its upper circuit of 4.65% on 3 Jun 2026, with buyers queuing and no sellers willing to part with shares.
Read full news article
FCS Software Solutions Ltd Locks at Upper Circuit With 4.88% Gain — Buyers Queue, Sellers Absent
At Rs 1.72, the buying was done — not because demand dried up, but because the exchange wouldn't let the stock go any higher. FCS Software Solutions Ltd locked at its upper circuit of 4.88% on 2 Jun 2026, with buyers queuing and no sellers willing to part with shares.
Read full news article Announcements
FCS Software Solutions Limited - Reply to Clarification- Financial results
05-Dec-2019 | Source : NSEFCS Software Solutions Limitedoftware Solutions Limited for the quarter ended 30-Sep-2019 with respect to Regulation 33 of the SEBI (Listing Obligations and Disclosure Requirements) Regulations, 2015.
FCS Software Solutions Limited - Clarification
18-Nov-2019 | Source : NSEFCS Software Solutions Limited with respect to announcement dated 14-Nov-2019, regarding Outcome of Board Meeting held on November 14, 2019. On basis of above the Company is required to clarify following: 1. Date of appointment/cessation (as applicable) & term of appointment 2. Brief profile (in case of appointment) 3. Disclosure of relationships between directors (in case of appointment of a director). The response of the Company is awaited.
FCS Software Solutions Limited - Outcome of Board Meeting
15-Nov-2019 | Source : NSEFCS Software Solutions Limited has informed the Exchange regarding Outcome of Board Meeting held on November 14, 2019.
Corporate Actions

No Upcoming Board Meetings

FCS Software Solutions Ltd has declared 5% dividend, ex-date: 03 Sep 09

FCS Software Solutions Ltd has announced 1:10 stock split, ex-date: 15 Oct 09

FCS Software Solutions Ltd has announced 1:1 bonus issue, ex-date: 26 Feb 10

No Rights history available
Quality key factors
Valuation key factors
Technicals key factors
 Technical Indicator Scale: Bearish, Mildly Bearish, Sideways, Mildly Bullish, Bullish Turned
 Shareholding Snapshot : Mar 2026
Shareholding Compare (%holding)
Non Institution
None
Held by 0 Schemes
Held by 3 FIIs (0.01%)
Dalip Kumar (10.88%)
Slg Softech Private Limited (6.27%)
65.96%
Quarterly Results Snapshot (Consolidated) - Mar'26 - YoY

YoY Growth in quarter ended Mar 2026 is 203.86% vs -8.23% in Mar 2025
YoY Growth in quarter ended Mar 2026 is 53,900.00% vs 100.88% in Mar 2025
Half Yearly Results Snapshot (Consolidated) - Sep'25

Growth in half year ended Sep 2025 is -10.61% vs 3.24% in Sep 2024
Growth in half year ended Sep 2025 is -132.93% vs 149.60% in Sep 2024
Nine Monthly Results Snapshot (Consolidated) - Dec'25
YoY Growth in nine months ended Dec 2025 is 13.16% vs 2.82% in Dec 2024
YoY Growth in nine months ended Dec 2025 is -174.73% vs 139.03% in Dec 2024
Annual Results Snapshot (Consolidated) - Mar'26
YoY Growth in year ended Mar 2026 is 59.14% vs -0.08% in Mar 2025
YoY Growth in year ended Mar 2026 is -29.76% vs 130.95% in Mar 2025
About FCS Software Solutions Ltd

Company Coordinates


