Honeywell Auto

  • Market Cap: Small Cap
  • Industry: Industrial Manufacturing
  • ISIN: INE671A01010
  • NSEID: HONAUT
  • BSEID: 517174
INR
35,405.00
235 (0.67%)
BSENSE

Sep 03, 09:40 AM

BSE+NSE Vol: 313

  • Price Points
  • Score
  • Mojo Parameters
  • Total Return
  • News and Corporate Actions
  • Key factors
  • Shareholding
  • Financials
  • CompanyCV
stock-summaryPrice Point
High/Low

1Day

52 Week

Valuation
Technical
Day's Volume

CASH

313 (32.51%) Volume

Shareholding (Jun 2026)

FII

3.95%

Held by 130 FIIs

DII

11.31%

Held by 20 DIIs

Promoter

75.00%

Why is Honeywell Automation India Ltd falling/rising?

03-Sep-2026

As of 02-Sep, Honeywell Automation India Ltd's stock price is Rs 35,154.60, down 1.43%, reflecting a broader trend of underperformance against the Sensex and poor long-term growth metrics. The stock's bearish trend is indicated by its decline relative to sector performance and concerning valuation ratios.

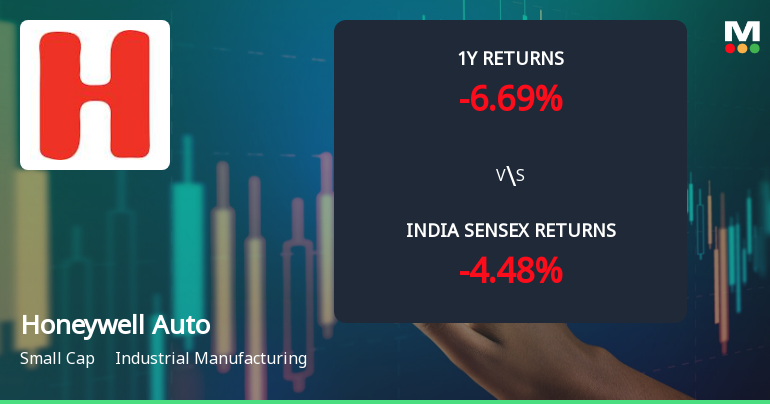
As of 02-Sep, Honeywell Automation India Ltd's stock price is falling, currently at Rs 35,154.60, reflecting a decrease of Rs 508.9 or 1.43%. This decline is part of a broader trend, as the stock has underperformed the benchmark Sensex, which has only decreased by 1.17% over the past week. Over the past month, the stock has dropped by 7.77%, while the Sensex has fallen by 1.95%. <BR><BR>The stock's performance today indicates it has underperformed its sector by 1.41%, with an intraday low of Rs 34,858.85, marking a 2.26% decrease. Despite being higher than the 200-day moving average, it is lower than the shorter-term moving averages (5-day, 20-day, 50-day, and 100-day), suggesting a bearish trend in the near term.<BR><BR>Additionally, the company has shown poor long-term growth, with net sales growing at an annual rate of only 9.48% and operating profit at 2.01% over the last five years. The return on capital employed (ROCE) is at its lowest at 15.98%, and the stock's return on equity (ROE) of 12.6 indicates a very expensive valuation with a price-to-book value of 7. This valuation is concerning, especially since the stock has generated a return of -6.69% over the past year, despite profits rising by 9.5%. <BR><BR>Moreover, the stock has consistently underperformed against the benchmark over the last three years, contributing to investor sentiment that may be driving the stock price lower. Overall, these factors combined indicate a challenging environment for Honeywell Automation India Ltd, leading to its current decline in stock price.

View full answer

Should I buy, sell or hold Honeywell Automation India Ltd?

02-Sep-2026

Who are in the management team of Honeywell Auto?

01-Sep-2026

The management team of Honeywell Auto includes Ashish Gaikwad (Managing Director), Ganesh Natarajan (Chairman), and several directors such as Neera Saggi and Ashish Modi, along with Indu Daryani as Company Secretary. This diverse team provides strong leadership and expertise to the company.

The management team of Honeywell Auto includes the following individuals:<BR><BR>1. **Ashish Gaikwad** - Managing Director<BR>2. **Neera Saggi** - Non-Executive & Independent Director<BR>3. **Ashish Modi** - Non-Executive & Non-Independent Director<BR>4. **Ganesh Natarajan** - Chairman & Independent Director<BR>5. **Atul Pai** - Non-Executive & Non-Independent Director<BR>6. **Rajesh Rege** - Director<BR>7. **Indu Daryani** - Company Secretary & Compliance Officer<BR>8. **Nisha Gupta** - Director<BR>9. **Brian Scott Rudick** - Additional Director<BR><BR>This team brings a diverse range of expertise and leadership to the company.

View full answer

What does Honeywell Auto do?

01-Sep-2026

Honeywell Automation India Ltd is a leading company in the Electronics-Instrumentation and Process Control Equipment industry, with recent net sales of ₹1,204 Cr and a net profit of ₹151 Cr as of June 2026. It has a market cap of ₹32,303 Cr and key metrics include a P/E ratio of 56.00 and a dividend yield of 0.30%.

Overview:<BR>Honeywell Automation India Ltd is a market leader in the Electronics-Instrumentation and Process Control Equipment industry, operating within the small-cap category.<BR><BR>History:<BR>The company was incorporated in January 1984 as 'Tata Process Controls Private Limited' in Maharashtra. The latest quarterly results reported net sales and net profit for June 2026.<BR><BR>Financial Snapshot:<BR>Most recent Net Sales: 1,204 Cr (Quarterly Results - Jun 2026) <BR>Most recent Net Profit: 151 Cr (Quarterly Results - Jun 2026) <BR>Market-cap value: INR 32,303 Cr (Small Cap)<BR><BR>Key Metrics:<BR>P/E: 56.00 <BR>Industry P/E: 56 <BR>Dividend Yield: 0.30% <BR>Debt-Equity: -0.83 <BR>Return on Equity: 12.55% <BR>Price to Book: 7.25 <BR><BR>Contact Details:<BR>Address: 56 & 57, Hadapsar Industrial Estate Pune Maharashtra : 411013 <BR>Phone: 91-20-66039400 <BR>Email: HAIL.InvestorServices@honeywell.com <BR>Website: http://www.honeywellautomationindia.com

View full answer

Who are the peers of the Honeywell Auto?

01-Sep-2026

Honeywell Auto's peers include Syrma SGS Tech, Kaynes Tech, Jyoti CNC Auto, LMW, Lloyds Engineering, Tega Industries, Titagarh Rail, and Jupiter Wagons. Syrma SGS Tech leads in 1-year returns at 90.97%, while Honeywell Auto has a return of -8.40%.

Peers: The peers of Honeywell Auto are Syrma SGS Tech., Kaynes Tech, Jyoti CNC Auto., LMW, Lloyds Engineeri, Tega Inds., Titagarh Rail, and Jupiter Wagons.<BR><BR>Quality Snapshot: Excellent management risk is observed at Honeywell Auto, Jyoti CNC Auto., Tega Inds., Titagarh Rail, and Jupiter Wagons, while Average management risk is found at Syrma SGS Tech., Kaynes Tech, LMW, and Lloyds Engineeri. Below Average growth is seen in Honeywell Auto, Jyoti CNC Auto., LMW, and Tega Inds., while Excellent growth is noted at Syrma SGS Tech., Kaynes Tech, Lloyds Engineeri, and Jupiter Wagons. Capital Structure is rated Excellent for Honeywell Auto, LMW, Lloyds Engineeri, and Tega Inds., while Good is observed at Syrma SGS Tech., Kaynes Tech, and Jyoti CNC Auto., and Average at Titagarh Rail.<BR><BR>Return Snapshot: The peer with the highest 1-year return is Syrma SGS Tech. at 90.97%, while Kaynes Tech has the lowest at -39.90%. Honeywell Auto's 1-year return is -8.40%, which is better than Kaynes Tech but significantly lower than Syrma SGS Tech. Additionally, Tega Inds. and Jupiter Wagons have negative six-month returns.

View full answer

How big is Honeywell Auto?

01-Sep-2026

As of 31st August, Honeywell Automation India Ltd has a market capitalization of 32,303.00 Cr, with recent net sales of 4,703.20 Cr and a net profit of 551.10 Cr.

As of 31st August, Honeywell Automation India Ltd has a market capitalization of 32,303.00 Cr, categorizing it as a Small Cap company.<BR><BR>In the latest 4 quarters, Honeywell Automation India Ltd reported Net Sales of 4,703.20 Cr and a Net Profit of 551.10 Cr.<BR><BR>The latest annual period for the balance sheet is March 2026, with Shareholder's Funds amounting to 4,462.70 Cr and Total Assets of 6,116.90 Cr.

View full answer

Are Honeywell Automation India Ltd latest results good or bad?

30-Jul-2026

Honeywell Automation India Ltd's latest results show a mixed performance, with a 20.90% year-over-year net profit growth to ₹150.70 crores, but a 5.63% decline from the previous quarter and modest revenue growth of 1.80%. The company faces challenges with margin compression due to rising employee costs, indicating potential headwinds ahead.

Honeywell Automation India Ltd's latest results present a mixed picture. On one hand, the company reported a net profit of ₹150.70 crores for Q1 FY27, which reflects a positive year-over-year growth of 20.90%. However, this figure represents a decline of 5.63% compared to the previous quarter. <BR><BR>Revenue growth was modest, with a year-over-year increase of just 1.80%, indicating tepid demand in the industrial automation sector. Sequentially, revenue grew by only 2.01%, which raises concerns about the company's ability to leverage India's infrastructure and manufacturing push effectively.<BR><BR>The company's operating margins also faced pressure, contracting by 133 basis points to 14.32%, primarily due to a significant rise in employee costs, which outpaced revenue growth. This margin compression is a notable concern as it suggests challenges in maintaining profitability.<BR><BR>Overall, while Honeywell Automation India maintains its position as a leader in the industrial manufacturing sector, the mixed results, characterized by sluggish revenue growth and margin compression, suggest that the company is facing some headwinds. Investors may need to weigh these factors carefully when considering the company's performance.

View full answer

Is Honeywell Auto technically bullish or bearish?

26-Nov-2025

As of November 25, 2025, Honeywell Auto's technical trend has shifted to bearish, supported by negative indicators across MACD, moving averages, and Bollinger Bands, despite a mildly bullish OBV.

As of 25 November 2025, the technical trend for Honeywell Auto has changed from mildly bearish to bearish. The current stance is bearish with strong indicators supporting this view. Both the weekly and monthly MACD are bearish, and the daily moving averages also indicate a bearish trend. The Bollinger Bands reflect a bearish sentiment on both weekly and monthly time frames. The KST is bearish across both time frames, while the Dow Theory shows a mildly bearish trend on the monthly chart. Although the OBV is mildly bullish on both weekly and monthly, it does not outweigh the overall bearish signals. The stock has underperformed significantly compared to the Sensex over multiple periods, further reinforcing the bearish outlook.

View full answer

How has been the historical performance of Honeywell Auto?

06-Nov-2025

Honeywell Auto has shown consistent growth in net sales and profit, with net sales increasing from 3,174.74 Cr in March 2019 to 4,189.60 Cr in March 2025, and profit after tax rising from 358.84 Cr to 523.60 Cr in the same period, indicating strong financial performance. Total assets and liabilities also grew significantly, reflecting balanced growth.

Answer:<BR>The historical performance of Honeywell Auto shows a consistent growth trend in net sales and profit over the years, with the latest figures for March 2025 indicating net sales of 4,189.60 Cr and a profit after tax of 523.60 Cr.<BR><BR>Breakdown:<BR>Honeywell Auto's net sales have steadily increased from 3,174.74 Cr in March 2019 to 4,189.60 Cr in March 2025, reflecting a strong upward trajectory. The total operating income followed a similar trend, rising from 3,174.74 Cr in March 2019 to 4,189.60 Cr in March 2025. Operating profit, excluding other income, peaked at 589.40 Cr in March 2024 but slightly decreased to 584.60 Cr in March 2025. The profit before tax also showed growth, reaching 705.60 Cr in March 2025, up from 554.89 Cr in March 2019. Profit after tax has increased from 358.84 Cr in March 2019 to 523.60 Cr in March 2025, indicating improved profitability. The company's total assets grew from 3,400.59 Cr in March 2020 to 5,513.60 Cr in March 2025, while total liabilities increased from 3,400.59 Cr to 5,513.60 Cr in the same period, reflecting a balanced growth in both assets and liabilities. Cash flow from operating activities has remained positive, with the latest figure at 426.00 Cr in March 2025, contributing to a closing cash and cash equivalent of 3,130.00 Cr. Overall, Honeywell Auto has demonstrated robust financial performance over the years, characterized by increasing revenues and profits alongside growing assets.

View full answer

Who are the top shareholders of the Honeywell Auto?

17-Jul-2025

The top shareholders of Honeywell Auto are Hail Mauritius Limited with 75.0%, followed by SBI Magnum Midcap Fund at 4.72%. Mutual funds hold 10.8%, foreign institutional investors have 2.59%, and individual investors account for 8.46%.

The top shareholders of Honeywell Auto include Hail Mauritius Limited, which holds the largest stake at 75.0%. The company is primarily backed by its promoters, who are the majority shareholders. In terms of public investment, the SBI Magnum Midcap Fund is the highest public shareholder with a holding of 4.72%. Additionally, mutual funds collectively hold 10.8% through 27 schemes, while foreign institutional investors (FIIs) have a stake of 2.59% across 98 entities. Individual investors account for 8.46% of the shareholding.

View full answer

Is Honeywell Auto overvalued or undervalued?

09-Jun-2025

As of November 3, 2024, Honeywell Auto is considered very expensive and overvalued with a PE ratio of 65.93, significantly higher than its peers, and has underperformed the Sensex with a year-to-date return of -6.30%.

As of 3 November 2024, Honeywell Auto's valuation grade has moved from does not qualify to very expensive, indicating a significant shift in its market perception. The company is currently deemed overvalued, with a PE ratio of 65.93, a Price to Book Value of 9.16, and an EV to EBITDA of 54.27. These ratios suggest that the stock is trading at a premium compared to its earnings and book value.<BR><BR>In comparison to its peers, Honeywell Auto's PE ratio is notably higher than Kaynes Tech's 125.17 and Genus Power's 38.52, which further underscores its overvaluation. Additionally, while Honeywell Auto's ROCE stands at an impressive 57.40%, its PEG ratio of 14.89 indicates that growth expectations are not justified by its current price. Recent stock performance shows Honeywell Auto underperforming against the Sensex, with a year-to-date return of -6.30% compared to the Sensex's 5.63%, reinforcing the notion that the stock may be overpriced in the current market environment.

View full answer

When is the next results date for Honeywell Auto?

06-Jun-2025

No Upcoming Board Meetings

Has Honeywell Auto declared dividend?

06-Jun-2025

Yes, Honeywell Automation India Ltd has declared a dividend of 1050%, amounting to ₹100 per share, with an ex-date of June 16, 2025. While recent total returns show mixed performance, the five-year outlook indicates a positive total return of 40.51%.

Honeywell Automation India Ltd has declared a dividend.<BR><BR>Dividend Details:<BR>- Percentage announced: 1050%<BR>- Amount per share: 100 per share<BR>- Ex-date: 16 Jun 25<BR><BR>Dividend Yield: 0.26%.<BR><BR>Total Returns by Period:<BR>In the last 6 months, the price return was -3.79%, the dividend return was 0.26%, resulting in a total return of -3.53%.<BR><BR>Over the past year, the price return was -25.06%, the dividend return was 0.38%, leading to a total return of -24.68%.<BR><BR>For the 2-year period, the price return was -4.43%, the dividend return was 0.71%, culminating in a total return of -3.72%.<BR><BR>In the 3-year timeframe, the price return was 24.45%, the dividend return was 1.17%, which resulted in a total return of 25.62%.<BR><BR>Over the last 4 years, the price return was -6.84%, the dividend return was 1.20%, leading to a total return of -5.64%.<BR><BR>In the 5-year period, the price return was 38.66%, the dividend return was 1.85%, resulting in a total return of 40.51%.<BR><BR>Overall, while Honeywell Automation India Ltd has declared a significant dividend, the total returns over the recent periods show a mixed performance, with some periods experiencing substantial losses in price return. However, the long-term outlook over five years indicates a positive total return, suggesting potential recovery and growth.

View full answer
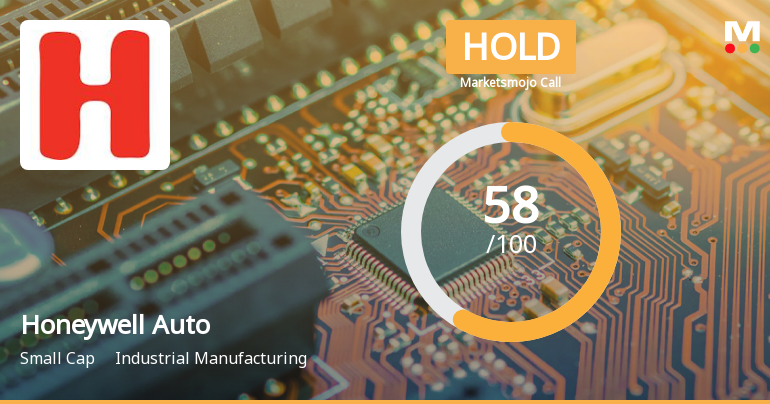
iScoreScore
Click here to find our call on this stock
Strong Sell
Sell
Hold
Buy
Strong Buy

Dashboard

1

Poor long term growth as Net Sales has grown by an annual rate of 9.48% and Operating profit at 2.01% over the last 5 years

 
2

Flat results in Jun 26

3

With ROE of 12.6, it has a Very Expensive valuation with a 7 Price to Book Value

stock-summaryMojo Parameters

Mojo Parameters

Loading Valuation Snapshot...

Stock DNA

stock-summary
Industry

Industrial Manufacturing

stock-summary
Market cap

INR 31,303 Cr (Small Cap)

stock-summary
P/E

56.00

stock-summary
Industry P/E

54

stock-summary
Dividend Yield

0.31%

stock-summary
Debt Equity

-0.83

stock-summary
Return on Equity

12.55%

stock-summary
Price to Book

6.97

Revenue and Profits:
Net Sales:
1,204 Cr
(Quarterly Results - Jun 2026)
Net Profit:
151 Cr
stock-summaryTotal Returns
Total Returns (Price + Dividend) stock-summary
Dividend Yield (0.31%)
TimePeriod
Price Return
Dividend Return
Total Return
3 Months
1.88%
0.32%
2.2%
6 Months
16.77%
0.37%
17.14%
1 Year
-3.67%
0.31%
-3.36%
2 Years
-30.23%
0.43%
-29.8%
3 Years
-10.13%
0.78%
-9.35%
4 Years
-16.11%
1.03%
-15.08%
5 Years
-11.84%
1.12%
-10.72%

Latest dividend: 110 per share ex-dividend date: Jul-17-2026

Risk Adjusted Returns v/s stock-summary
Returns Beta
Icon
Beta has not been calculated since enough price history is not available
stock-summaryNews & Corporate Actions

News

Announcements stock-summary

Honeywell Automation India Limited - Change in Director(s)

22-Oct-2019 | Source : NSE

Honeywell Automation India Limited has informed the Exchange regarding Change in Director(s) of the company.

Shareholders meeting

10-Aug-2019 | Source : NSE

Honeywell Automation India Limited has submitted the Exchange a copy Srutinizers report of Annual General Meeting held on August 09, 2019. Further, the company has informed the Exchange regarding voting results.

Financial Result Updates

09-Aug-2019 | Source : NSE

Honeywell Automation India Limited has submitted to the Exchange, the financial results for the period ended June 30, 2019.

Corporate Actions stock-summary

stock-summary
BOARD MEETING

No Upcoming Board Meetings

stock-summary
DIVIDEND

Honeywell Automation India Ltd has declared 1100% dividend, ex-date: 17 Jul 26

stock-summary
SPLITS

No Splits history available

stock-summary
BONUS

No Bonus history available

stock-summary
RIGHTS

No Rights history available

stock-summaryKey Factors

Quality key factors stock-summary

Factor
Value
Sales Growth (5y)
9.48%
EBIT Growth (5y)
2.01%
EBIT to Interest (avg)
96.41
Debt to EBITDA (avg)
0.12
Net Debt to Equity (avg)
-0.83
Sales to Capital Employed (avg)
1.07
Tax Ratio
25.93%
Dividend Payout Ratio
17.65%
Pledged Shares
0
Institutional Holding
15.26%
ROCE (avg)
58.39%
ROE (avg)
12.91%

Valuation key factors

Factor
Value
P/E Ratio
56
Industry P/E
54
Price to Book Value
6.97
EV to EBIT
47.06
EV to EBITDA
43.08
EV to Capital Employed
35.73
EV to Sales
5.83
PEG Ratio
5.87
Dividend Yield
0.31%
ROCE (Latest)
71.91%
ROE (Latest)
12.55%

Technicals key factors

Indicator
Weekly
Monthly
MACD
Mildly Bearish
Mildly Bullish
RSI
No Signal
No Signal
Bollinger Bands
Bearish
Sideways
Moving Averages
Mildly Bullish (Daily)
KST
Mildly Bearish
Mildly Bullish
Dow Theory
Mildly Bearish
Mildly Bearish
OBV
Mildly Bearish
No Trend
stock-summary Technical Indicator Scale: Bearish, Mildly Bearish, Sideways, Mildly Bullish, Bullish  Turned 
stock-summaryShareholding
Shareholding Snapshot : Jun 2026stock-summary
Shareholding Compare (%holding) stock-summary
Majority shareholders

Promoters

Pledged Promoter Holdings

None

Mutual Funds

Held by 25 Schemes (10.05%)

FIIs

Held by 130 FIIs (3.95%)

Promoter with highest holding

Hail Mauritius Limited (75.0%)

Highest Public shareholder

Sbi Small Cap Fund (6.1%)

Individual Investors Holdings

8.05%

stock-summaryFinancial
[
  {
    "link": "quarterly",
    "btn_text": "All Quarterly Results",
    "header": "Quarterly Results Snapshot (Standalone) - Jun'26 - YoY",
    "rhs": [
      {
        "prefix": "Net Sales ",
        "suffix": "YoY Growth in quarter ended Jun 2026 is 1.80% vs 23.19% in Jun 2025",
        "dir": -1
      },
      {
        "prefix": "Standalone Net Profit ",
        "suffix": "YoY Growth in quarter ended Jun 2026 is 20.95% vs -8.72% in Jun 2025",
        "dir": 1
      }
    ],
    "table": {
      "header": [
        "Jun'26",
        "Jun'25",
        "Change(%)"
      ],
      "body": [
        {
          "field": "Net Sales",
          "val1": "1,204.40",
          "val2": "1,183.10",
          "chgp": "1.80%",
          "chgp_class": "positive"
        },
        {
          "field": "Operating Profit (PBDIT) excl Other Income",
          "val1": "172.50",
          "val2": "141.50",
          "chgp": "21.91%",
          "chgp_class": "positive"
        },
        {
          "field": "Interest",
          "val1": "2.30",
          "val2": "1.90",
          "chgp": "21.05%",
          "chgp_class": "negative"
        },
        {
          "field": "Exceptional Items",
          "val1": "0.00",
          "val2": "0.00",
          "chgp": "",
          "chgp_class": "neutral"
        },
        {
          "field": "Standalone Net Profit",
          "val1": "150.70",
          "val2": "124.60",
          "chgp": "20.95%",
          "chgp_class": "positive"
        },
        {
          "field": "Operating Profit Margin (Excl OI)",
          "val1": "14.32%",
          "val2": "11.96%",
          "chgp": "2.36%",
          "chgp_class": "positive"
        }
      ]
    }
  },
  {
    "link": "half-yearly",
    "btn_text": "All Half Yearly Results",
    "header": "Half Yearly Results Snapshot (Standalone) - Sep'25",
    "rhs": [
      {
        "prefix": "Net Sales ",
        "suffix": " Growth in half year ended Sep 2025 is 17.55% vs -2.56% in Sep 2024",
        "dir": 1
      },
      {
        "prefix": "Standalone Net Profit ",
        "suffix": " Growth in half year ended Sep 2025 is -2.98% vs 11.67% in Sep 2024",
        "dir": -1
      }
    ],
    "table": {
      "header": [
        "Sep'25",
        "Sep'24",
        "Change(%)"
      ],
      "body": [
        {
          "field": "Net Sales",
          "val1": "2,332.50",
          "val2": "1,984.30",
          "chgp": "17.55%",
          "chgp_class": "positive"
        },
        {
          "field": "Operating Profit (PBDIT) excl Other Income",
          "val1": "273.10",
          "val2": "283.20",
          "chgp": "-3.57%",
          "chgp_class": "negative"
        },
        {
          "field": "Interest",
          "val1": "4.10",
          "val2": "2.60",
          "chgp": "57.69%",
          "chgp_class": "negative"
        },
        {
          "field": "Exceptional Items",
          "val1": "0.00",
          "val2": "0.00",
          "chgp": "",
          "chgp_class": "neutral"
        },
        {
          "field": "Standalone Net Profit",
          "val1": "244.10",
          "val2": "251.60",
          "chgp": "-2.98%",
          "chgp_class": "negative"
        },
        {
          "field": "Operating Profit Margin (Excl OI)",
          "val1": "11.71%",
          "val2": "14.27%",
          "chgp": "-2.56%",
          "chgp_class": "negative"
        }
      ]
    }
  },
  {
    "link": "nine-monthly",
    "btn_text": "All Nine Monthly Results",
    "header": "Nine Monthly Results Snapshot (Standalone) - Dec'25",
    "rhs": [
      {
        "prefix": "Net Sales ",
        "suffix": "YoY Growth in nine months ended Dec 2025 is 13.86% vs -1.04% in Dec 2024",
        "dir": 1
      },
      {
        "prefix": "Standalone Net Profit ",
        "suffix": "YoY Growth in nine months ended Dec 2025 is -4.80% vs 8.64% in Dec 2024",
        "dir": -1
      }
    ],
    "table": {
      "header": [
        "Dec'25",
        "Dec'24",
        "Change(%)"
      ],
      "body": [
        {
          "field": "Net Sales",
          "val1": "3,501.20",
          "val2": "3,075.10",
          "chgp": "13.86%",
          "chgp_class": "positive"
        },
        {
          "field": "Operating Profit (PBDIT) excl Other Income",
          "val1": "420.70",
          "val2": "425.20",
          "chgp": "-1.06%",
          "chgp_class": "negative"
        },
        {
          "field": "Interest",
          "val1": "8.20",
          "val2": "4.80",
          "chgp": "70.83%",
          "chgp_class": "negative"
        },
        {
          "field": "Exceptional Items",
          "val1": "-11.40",
          "val2": "0.00",
          "chgp": "",
          "chgp_class": "neutral"
        },
        {
          "field": "Standalone Net Profit",
          "val1": "365.30",
          "val2": "383.70",
          "chgp": "-4.80%",
          "chgp_class": "negative"
        },
        {
          "field": "Operating Profit Margin (Excl OI)",
          "val1": "12.02%",
          "val2": "13.83%",
          "chgp": "-1.81%",
          "chgp_class": "negative"
        }
      ]
    }
  },
  {
    "link": "annual",
    "btn_text": "All Annual Results",
    "header": "Annual Results Snapshot (Standalone) - Mar'26",
    "rhs": [
      {
        "prefix": "Net Sales ",
        "suffix": "YoY Growth in year ended Mar 2026 is 11.75% vs 3.24% in Mar 2025",
        "dir": 1
      },
      {
        "prefix": "Standalone Net Profit ",
        "suffix": "YoY Growth in year ended Mar 2026 is 0.27% vs 4.43% in Mar 2025",
        "dir": -1
      }
    ],
    "table": {
      "header": [
        "Mar'26",
        "Mar'25",
        "Change(%)"
      ],
      "body": [
        {
          "field": "Net Sales",
          "val1": "4,681.90",
          "val2": "4,189.60",
          "chgp": "11.75%",
          "chgp_class": "positive"
        },
        {
          "field": "Operating Profit (PBDIT) excl Other Income",
          "val1": "605.50",
          "val2": "584.60",
          "chgp": "3.58%",
          "chgp_class": "positive"
        },
        {
          "field": "Interest",
          "val1": "9.70",
          "val2": "6.70",
          "chgp": "44.78%",
          "chgp_class": "negative"
        },
        {
          "field": "Exceptional Items",
          "val1": "-12.30",
          "val2": "0.00",
          "chgp": "",
          "chgp_class": "neutral"
        },
        {
          "field": "Standalone Net Profit",
          "val1": "525.00",
          "val2": "523.60",
          "chgp": "0.27%",
          "chgp_class": "positive"
        },
        {
          "field": "Operating Profit Margin (Excl OI)",
          "val1": "12.93%",
          "val2": "13.95%",
          "chgp": "-1.02%",
          "chgp_class": "negative"
        }
      ]
    }
  }
]

Quarterly Results Snapshot (Standalone) - Jun'26 - YoYstock-summary

Jun'26
Jun'25
Change(%)
Net Sales
1,204.40
1,183.10
1.80%
Operating Profit (PBDIT) excl Other Income
172.50
141.50
21.91%
Interest
2.30
1.90
21.05%
Exceptional Items
0.00
0.00
Standalone Net Profit
150.70
124.60
20.95%
Operating Profit Margin (Excl OI)
14.32%
11.96%
2.36%
Values in Rs Cr.
Direction Arrows
Net Sales

YoY Growth in quarter ended Jun 2026 is 1.80% vs 23.19% in Jun 2025

Direction Arrows
Standalone Net Profit

YoY Growth in quarter ended Jun 2026 is 20.95% vs -8.72% in Jun 2025

Half Yearly Results Snapshot (Standalone) - Sep'25stock-summary

Sep'25
Sep'24
Change(%)
Net Sales
2,332.50
1,984.30
17.55%
Operating Profit (PBDIT) excl Other Income
273.10
283.20
-3.57%
Interest
4.10
2.60
57.69%
Exceptional Items
0.00
0.00
Standalone Net Profit
244.10
251.60
-2.98%
Operating Profit Margin (Excl OI)
11.71%
14.27%
-2.56%
Values in Rs Cr.
Direction Arrows
Net Sales

Growth in half year ended Sep 2025 is 17.55% vs -2.56% in Sep 2024

Direction Arrows
Standalone Net Profit

Growth in half year ended Sep 2025 is -2.98% vs 11.67% in Sep 2024

Nine Monthly Results Snapshot (Standalone) - Dec'25stock-summary

Dec'25
Dec'24
Change(%)
Net Sales
3,501.20
3,075.10
13.86%
Operating Profit (PBDIT) excl Other Income
420.70
425.20
-1.06%
Interest
8.20
4.80
70.83%
Exceptional Items
-11.40
0.00
Standalone Net Profit
365.30
383.70
-4.80%
Operating Profit Margin (Excl OI)
12.02%
13.83%
-1.81%
Values in Rs Cr.
Direction Arrows
Net Sales

YoY Growth in nine months ended Dec 2025 is 13.86% vs -1.04% in Dec 2024

Direction Arrows
Standalone Net Profit

YoY Growth in nine months ended Dec 2025 is -4.80% vs 8.64% in Dec 2024

Annual Results Snapshot (Standalone) - Mar'26stock-summary

Mar'26
Mar'25
Change(%)
Net Sales
4,681.90
4,189.60
11.75%
Operating Profit (PBDIT) excl Other Income
605.50
584.60
3.58%
Interest
9.70
6.70
44.78%
Exceptional Items
-12.30
0.00
Standalone Net Profit
525.00
523.60
0.27%
Operating Profit Margin (Excl OI)
12.93%
13.95%
-1.02%
Values in Rs Cr.
Direction Arrows
Net Sales

YoY Growth in year ended Mar 2026 is 11.75% vs 3.24% in Mar 2025

Direction Arrows
Standalone Net Profit

YoY Growth in year ended Mar 2026 is 0.27% vs 4.43% in Mar 2025

stock-summaryCompany CV
About Honeywell Automation India Ltd stock-summary
stock-summary
Honeywell Automation India Ltd
Small Cap
Industrial Manufacturing
Honeywell Automation India Limited (HAIL) is a market leader in Electronics-Instrumentation and Process Control Equipment industry. The Company's main products are distributed control systems, building control systems and smart transmitters. The Company is engaged primarily in the business of Automation & Control systems on turnkey basis and otherwise. Honeywell Automation India Limited was incorporated in January, 1984 as 'Tata Process Controls Private Limited' in Maharashtra.
Company Coordinates stock-summary
Company Details
56 & 57, Hadapsar Industrial Estate Pune Maharashtra : 411013
stock-summary
Tel: 91-20-66039400
stock-summary
HAIL.InvestorServices@honeywell.com
Registrar Details
TSR Darashaw Ltd, 6-10 , Haji Moosa Patrawala Indl. Est , 20 Dr.E.Moses Road , Mahalaxmi , Mumbai