
Compare BAG Films with Similar Stocks
Dashboard
Poor Management Efficiency with a low ROE of 2.47%
- The company has been able to generate a Return on Equity (avg) of 2.47% signifying low profitability per unit of shareholders funds
- OPERATING PROFIT TO INTEREST (Q) Lowest at 1.52 times
- PBDIT(Q) Lowest at Rs 2.87 cr.
- OPERATING PROFIT TO NET SALES (Q) Lowest at 7.19%
Below par performance in long term as well as near term
Stock DNA
Media & Entertainment
INR 87 Cr (Micro Cap)
14.00
16
0.00%
-0.02
4.07%
0.56
Total Returns (Price + Dividend) 
Latest dividend: 0.20000000000000004 per share ex-dividend date: Aug-08-2008
Risk Adjusted Returns v/s
Returns Beta

News
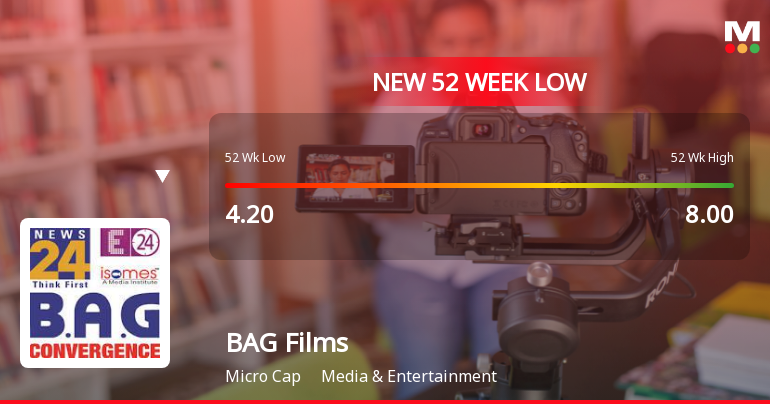
B A G Films & Media Ltd Falls to 52-Week Low of Rs 3.77 as Sell-Off Deepens
A sharp decline over the past three sessions has dragged B A G Films & Media Ltd to a fresh 52-week low of Rs 3.77 on 30 Mar 2026, marking a 9.15% loss in that period. This drop comes amid broader market weakness, but the stock’s underperformance is notably more severe than its sector peers and the benchmark indices.
Read full news article
B A G Films & Media Ltd Falls to 52-Week Low of Rs 4.01 as Sell-Off Deepens
For the second consecutive session, B A G Films & Media Ltd closed lower, slipping to a fresh 52-week low of Rs 4.01 on 27 Mar 2026. This decline comes amid a broader sector downturn, but the stock’s underperformance remains stark compared to the already subdued market environment.
Read full news article
B A G Films & Media Ltd is Rated Strong Sell
B A G Films & Media Ltd is rated 'Strong Sell' by MarketsMOJO, with this rating last updated on 13 February 2026. However, the analysis and financial metrics presented here reflect the stock's current position as of 27 March 2026, providing investors with an up-to-date view of the company’s fundamentals, returns, and market performance.
Read full news article Announcements
B.A.G Films and Media Limited - Updates
18-Nov-2019 | Source : NSEB.A.G Films and Media Limited has informed the Exchange regarding 'Submission of Newspaper Publication of Un-Audited Financial Results for the Quarter and Six Months Ended September 30, 2019'.
B.A.G Films and Media Limited - Outcome of Board Meeting
15-Nov-2019 | Source : NSEB.A.G Films and Media Limited has informed the Exchange regarding Board meeting held on November 14, 2019.
B.A.G Films and Media Limited - Updates
01-Nov-2019 | Source : NSEB.A.G Films and Media Limited has informed the Exchange regarding 'Submission of Newspaper Advertisement Published for Intimation of Board Meeting'.
Corporate Actions

No Upcoming Board Meetings

B A G Films & Media Ltd has declared 10% dividend, ex-date: 08 Aug 08

No Splits history available

No Bonus history available

No Rights history available
Quality key factors
Valuation key factors
Technicals key factors
 Technical Indicator Scale: Bearish, Mildly Bearish, Sideways, Mildly Bullish, Bullish Turned
 Shareholding Snapshot : Dec 2025
Shareholding Compare (%holding)
Non Institution
None
Held by 0 Schemes
Held by 0 FIIs
Arvr Communications Private Limited (19.3%)
High Growth Distributors Private Limited (6.61%)
41.49%
Quarterly Results Snapshot (Consolidated) - Dec'25 - QoQ

QoQ Growth in quarter ended Dec 2025 is 11.69% vs 13.60% in Sep 2025

QoQ Growth in quarter ended Dec 2025 is 97.22% vs -77.50% in Sep 2025
Half Yearly Results Snapshot (Consolidated) - Sep'25
Growth in half year ended Sep 2025 is 6.78% vs -7.86% in Sep 2024
Growth in half year ended Sep 2025 is 16.67% vs -67.32% in Sep 2024
Nine Monthly Results Snapshot (Consolidated) - Dec'25
YoY Growth in nine months ended Dec 2025 is 13.90% vs 2.80% in Dec 2024
YoY Growth in nine months ended Dec 2025 is 2.69% vs -42.73% in Dec 2024
Annual Results Snapshot (Consolidated) - Mar'25
YoY Growth in year ended Mar 2025 is 3.11% vs 18.04% in Mar 2024
YoY Growth in year ended Mar 2025 is 56.03% vs 336.90% in Mar 2024
About B A G Films & Media Ltd

Company Coordinates


