
Compare Fiberweb (India) with Similar Stocks
Stock DNA
Garments & Apparels
INR 86 Cr (Micro Cap)
9.00
25
0.00%
0.00
5.45%
0.47
Total Returns (Price + Dividend) 
Latest dividend: 0.5 per share ex-dividend date: Sep-22-2020
Risk Adjusted Returns v/s
Returns Beta

News

Fiberweb (India) Ltd Valuation Shifts Signal Renewed Price Attractiveness Amid Sector Challenges
Fiberweb (India) Ltd, a micro-cap player in the Garments & Apparels sector, has seen its valuation parameters improve notably, shifting from very attractive to attractive territory. Despite a challenging market backdrop and underwhelming returns relative to the Sensex, the stock’s current price-to-earnings (P/E) and price-to-book value (P/BV) ratios suggest a compelling entry point for value-oriented investors.
Read full news article
Fiberweb (India) Ltd is Rated Strong Sell
Fiberweb (India) Ltd is rated Strong Sell by MarketsMOJO. This rating was last updated on 04 May 2026, reflecting a reassessment of the stock’s outlook. However, all fundamentals, returns, and financial metrics discussed below are current as of 16 June 2026, providing investors with the latest perspective on the company’s position.
Read full news article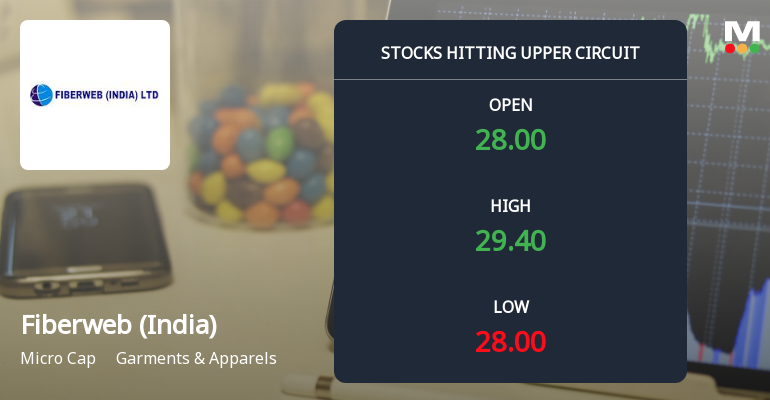
Fiberweb (India) Ltd Locks at Upper Circuit With 4.99% Gain — Buyers Queue, Sellers Absent
At Rs 29.23, the buying was done — not because demand dried up, but because the exchange wouldn't let the stock go any higher. Fiberweb (India) Ltd locked at its upper circuit of 4.99% on 15 Jun 2026, with buyers queuing and no sellers willing to part with shares.
Read full news article Announcements
Corporate Actions

No Upcoming Board Meetings

Fiberweb (India) Ltd has declared 5% dividend, ex-date: 22 Sep 20

No Splits history available

Fiberweb (India) Ltd has announced 1:1 bonus issue, ex-date: 17 Jan 18

No Rights history available
Quality key factors
Valuation key factors
Technicals key factors
 Technical Indicator Scale: Bearish, Mildly Bearish, Sideways, Mildly Bullish, Bullish Turned
 Shareholding Snapshot : Mar 2026
Shareholding Compare (%holding)
Non Institution
None
Held by 9 Schemes (0.18%)
Held by 5 FIIs (0.17%)
Bhavesh Sheth (28.65%)
Dheeraj Kumar Lohia (3.58%)
48.51%
Quarterly Results Snapshot (Standalone) - Mar'26 - YoY

YoY Growth in quarter ended Mar 2026 is -63.68% vs 29.40% in Mar 2025
YoY Growth in quarter ended Mar 2026 is -130.34% vs 42.33% in Mar 2025
Half Yearly Results Snapshot (Standalone) - Sep'25

Growth in half year ended Sep 2025 is -0.34% vs -2.53% in Sep 2024
Growth in half year ended Sep 2025 is 18.17% vs 192.73% in Sep 2024
Nine Monthly Results Snapshot (Standalone) - Dec'25
YoY Growth in nine months ended Dec 2025 is 0.42% vs 14.10% in Dec 2024
YoY Growth in nine months ended Dec 2025 is 15.52% vs 167.11% in Dec 2024
Annual Results Snapshot (Standalone) - Mar'26
YoY Growth in year ended Mar 2026 is -16.52% vs 17.78% in Mar 2025
YoY Growth in year ended Mar 2026 is -33.27% vs 106.33% in Mar 2025
About Fiberweb (India) Ltd

Company Coordinates


