
Compare Blu.Coast Hotel. with Similar Stocks
Stock DNA
Hotels & Resorts
INR 53 Cr (Micro Cap)
NA (Loss Making)
37
0.00%
-0.77
9.70%
-2.51
Total Returns (Price + Dividend) 
Blu.Coast Hotel. for the last several years.
Risk Adjusted Returns v/s
Returns Beta

News
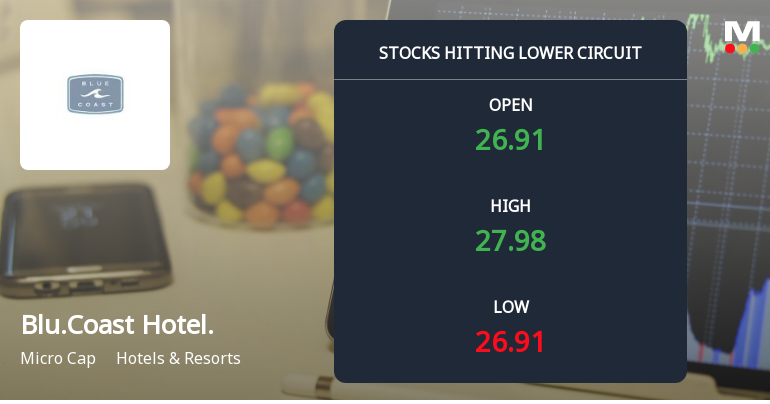
Blue Coast Hotels Ltd Locks at Lower Circuit With 4.8% Loss — Sellers Queue, No Buyers in Sight
At Rs 26.91, sellers were still queuing — but there were no buyers willing to take the other side. Blue Coast Hotels Ltd locked at its lower circuit of 4.84% on 19 Jun 2026, with unfilled sell orders and a frozen price.
Read full news article
Blue Coast Hotels Ltd Locks at Lower Circuit With 4.79% Loss — Sellers Queue, No Buyers in Sight
At Rs 27.6, sellers were still queuing — but there were no buyers willing to take the other side. Blue Coast Hotels Ltd locked at its lower circuit of 4.79% on 17 Jun 2026, with unfilled sell orders and a frozen price.
Read full news article
Blue Coast Hotels Ltd is Rated Strong Sell
Blue Coast Hotels Ltd is rated Strong Sell by MarketsMOJO. This rating was last updated on 31 December 2025. However, the analysis and financial metrics discussed below reflect the company’s current position as of 17 June 2026, providing investors with an up-to-date view of the stock’s fundamentals, valuation, financial trends, and technical outlook.
Read full news article Announcements
Blue Coast Hotels Limited - Outcome of Board Meeting
15-Nov-2019 | Source : NSEBlue Coast Hotels Limited has informed the Exchange regarding Board meeting held on November 14, 2019.
AGM\/Book Closure
03-Sep-2019 | Source : NSE
| Blue Coast Hotels Limited has informed the Exchange that the Register of Members & Share Transfer Books of the Company will remain closed from September 21, 2019 to September 27, 2019 (both days inclusive) for the purpose of Annual General Meeting. |
Outcome of Board Meeting
12-Aug-2019 | Source : NSE
| Blue Coast Hotels Limited has informed the Exchange regarding Board meeting held on August 12, 2019. |
Corporate Actions

No Upcoming Board Meetings

No Dividend history available

No Splits history available

No Bonus history available

No Rights history available
Quality key factors
Valuation key factors
Technicals key factors
 Technical Indicator Scale: Bearish, Mildly Bearish, Sideways, Mildly Bullish, Bullish Turned
 Shareholding Snapshot : May 2026
Shareholding Compare (%holding)
Promoters
None
Held by 0 Schemes
Held by 0 FIIs
Solace Investments & Financial Services Private Limited (9.03%)
Jetty Capital Limited (11.75%)
4.18%
Quarterly Results Snapshot (Consolidated) - Mar'26 - YoY
YoY Growth in quarter ended Mar 2026 is 0.00% vs 0.00% in Mar 2025

YoY Growth in quarter ended Mar 2026 is 95.58% vs 10.20% in Mar 2025
Half Yearly Results Snapshot (Consolidated) - Sep'25
Growth in half year ended Sep 2025 is 0.00% vs 0.00% in Sep 2024

Growth in half year ended Sep 2025 is -101.89% vs 3,549.59% in Sep 2024
Nine Monthly Results Snapshot (Consolidated) - Dec'25
YoY Growth in nine months ended Dec 2025 is 0.00% vs 0.00% in Dec 2024
YoY Growth in nine months ended Dec 2025 is -102.39% vs 2,266.49% in Dec 2024
Annual Results Snapshot (Consolidated) - Mar'26
YoY Growth in year ended Mar 2026 is 0.00% vs 0.00% in Mar 2025
YoY Growth in year ended Mar 2026 is -102.61% vs 1,192.90% in Mar 2025
About Blue Coast Hotels Ltd

Company Coordinates


