
Compare Nelcast with Similar Stocks
Stock DNA
Castings & Forgings
INR 1,197 Cr (Micro Cap)
25.00
46
0.37%
0.29
8.12%
2.00
Total Returns (Price + Dividend) 
Latest dividend: 0.5 per share ex-dividend date: Jul-25-2025
Risk Adjusted Returns v/s
Returns Beta

News
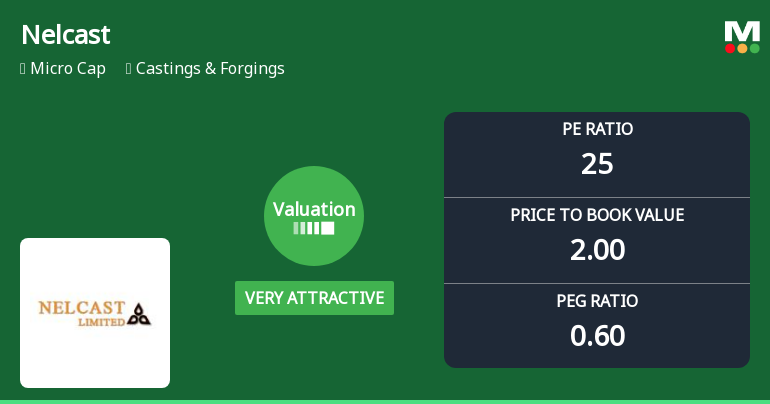
Nelcast Ltd. Valuation Shifts to Very Attractive Amid Market Volatility
Nelcast Ltd., a micro-cap player in the Castings & Forgings sector, has seen a significant shift in its valuation parameters, moving from an attractive to a very attractive rating. This change comes amid robust stock performance that has outpaced the broader Sensex over multiple time horizons, signalling renewed investor interest despite a recent intraday price dip.
Read full news article
Nelcast Ltd. is Rated Buy by MarketsMOJO
Nelcast Ltd. is rated Buy by MarketsMOJO, with this rating last updated on 11 May 2026. However, the analysis and financial metrics presented here reflect the stock’s current position as of 03 June 2026, providing investors with the most up-to-date view of the company’s fundamentals, returns, and market performance.
Read full news article
Nelcast Ltd. Valuation Shifts Signal Renewed Price Attractiveness Amid Sector Dynamics
Nelcast Ltd., a micro-cap player in the Castings & Forgings sector, has seen a notable improvement in its valuation parameters, prompting an upgrade in its MarketsMOJO Mojo Grade from Hold to Buy as of 11 May 2026. With its price-to-earnings (P/E) ratio and price-to-book value (P/BV) moving into more attractive territory relative to historical and peer averages, the stock is increasingly viewed as a compelling investment option amid a challenging market backdrop.
Read full news article Announcements
Nelcast Limited - Clarification
09-Dec-2019 | Source : NSENelcast Limited with respect to announcement dated 05-Dec-2019, regarding Credit Rating. On basis of above the Company is required to clarify following: 1. In case of downward rating, the disclosure may include reasons published by rating agency for such downward rating.
Nelcast Limited - Credit Rating
05-Dec-2019 | Source : NSENelcast Limited has informed the Exchange regarding Credit Rating
Nelcast Limited - Analysts/Institutional Investor Meet/Con. Call Updates
13-Nov-2019 | Source : NSENelcast Limited has informed the Exchange regarding Analysts/Institutional Investor Meet/Con. Call Updates
Corporate Actions

No Upcoming Board Meetings

Nelcast Ltd. has declared 35% dividend, ex-date: 20 Jul 26

Nelcast Ltd. has announced 2:10 stock split, ex-date: 06 Sep 11

No Bonus history available

No Rights history available
Quality key factors
Valuation key factors
Technicals key factors
 Technical Indicator Scale: Bearish, Mildly Bearish, Sideways, Mildly Bullish, Bullish Turned
 Shareholding Snapshot : Mar 2026
Shareholding Compare (%holding)
Promoters
None
Held by 0 Schemes
Held by 4 FIIs (0.36%)
P Deepak (39.63%)
Kanuri Family Trust (2.73%)
18.23%
Quarterly Results Snapshot (Consolidated) - Mar'26 - QoQ

QoQ Growth in quarter ended Mar 2026 is 11.70% vs 10.34% in Dec 2025

QoQ Growth in quarter ended Mar 2026 is -3.96% vs 234.03% in Dec 2025
Half Yearly Results Snapshot (Consolidated) - Sep'25
Growth in half year ended Sep 2025 is 0.01% vs -3.16% in Sep 2024
Growth in half year ended Sep 2025 is -2.87% vs -25.40% in Sep 2024
Nine Monthly Results Snapshot (Consolidated) - Dec'25
YoY Growth in nine months ended Dec 2025 is 4.15% vs -5.10% in Dec 2024
YoY Growth in nine months ended Dec 2025 is 39.62% vs -51.87% in Dec 2024
Annual Results Snapshot (Consolidated) - Mar'26
YoY Growth in year ended Mar 2026 is 6.13% vs -1.20% in Mar 2025
YoY Growth in year ended Mar 2026 is 29.87% vs -31.46% in Mar 2025
About Nelcast Ltd.

Company Coordinates


