
Compare Standard Inds. with Similar Stocks
Stock DNA
Realty
INR 81 Cr (Micro Cap)
NA (Loss Making)
20
4.68%
-0.31
-13.51%
0.58
Total Returns (Price + Dividend) 
Latest dividend: 0.55 per share ex-dividend date: Feb-20-2026
Risk Adjusted Returns v/s
Returns Beta

News
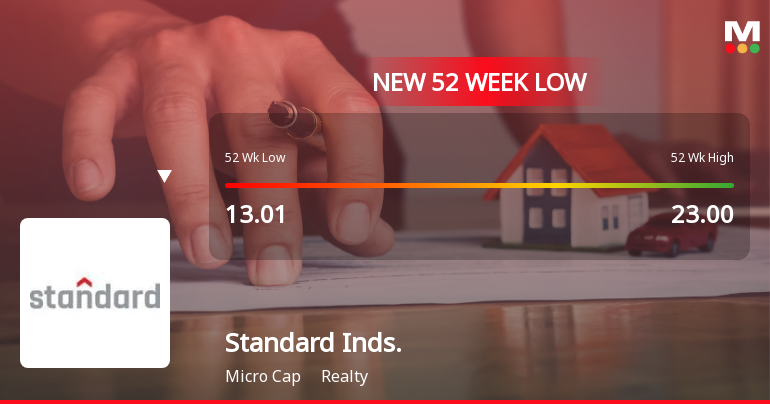
Five Consecutive Losses Push Standard Industries Ltd to a New 52-Week Low
For the fifth straight session, Standard Industries Ltd closed lower, breaching its 52-week low at Rs 12 on 30 Mar 2026. This marks a significant decline amid a broader market downturn, with the stock underperforming its sector and the benchmark indices.
Read full news article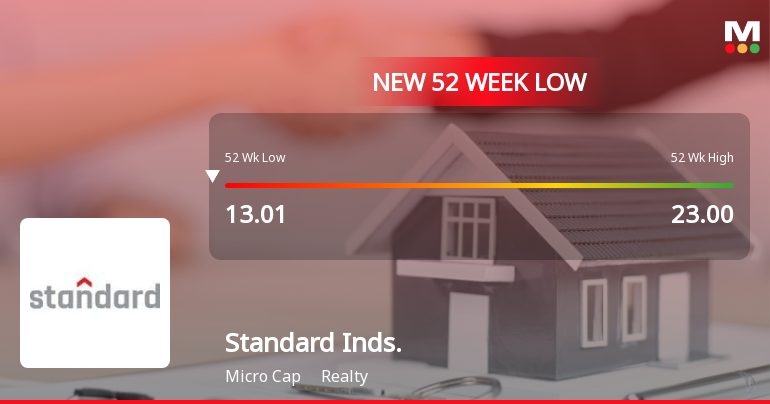
Standard Industries Ltd Falls to 52-Week Low of Rs 12.84 as Sell-Off Deepens
For the fifth consecutive session, Standard Industries Ltd closed lower, slipping to a fresh 52-week low of Rs 12.84 on 27 Mar 2026. This decline comes amid a broader market downturn, but the stock’s underperformance is notably sharper than its sector peers.
Read full news article
Standard Industries Ltd is Rated Strong Sell
Standard Industries Ltd is rated Strong Sell by MarketsMOJO, with this rating last updated on 27 Feb 2026. However, the analysis and financial metrics discussed here reflect the stock’s current position as of 27 March 2026, providing investors with the most recent and relevant data to assess the company’s outlook.
Read full news article Announcements
Standard Industries Limited - Press Release
23-Oct-2019 | Source : NSEStandard Industries Limited has informed the Exchange regarding a press release dated October 20, 2019, titled "Pursuant to Regulation 4 7 of the SEBI (Listing Obligations and Disclosure
Standard Industries Limited - Outcome of Board Meeting
22-Oct-2019 | Source : NSEStandard Industries Limited has informed the Exchange regarding Board meeting held on October 19, 2019.This is to inform you that the Board of Directors of the Company at its meeting held today, i.e. 19th October, 2019, considered and approved the Unaudited Financial Results (Standalone and Consolidated) of the Company for the Quarter and Six Months ended 30th September, 2019.
Resignation
11-Sep-2019 | Source : NSE
| Standard Industries Limited has informed the Exchange regarding Resignation of Mr Madhav Laxman Apte as Non- Executive Independent Director of the company w.e.f. September 11, 2019.Pursuant to Regulation 30 of SEBI (Listing Obligations and Disclosure Requirements) Regulations, 2015, we inform you that Shri M. L. Apte (DIN:00003656), Independent Director of the Company has resigned with effect from 11th September, 2019 on account of advance age and ill health.Shri M. L. Apte has confirmed that there are no other material reasons for his resignation as an Independent Director on the Board of the Company.We enclose herewith Resignation letter dated 11th September, 2019 of Shri M. L. Apte for your record. This is for your information and records. |
Corporate Actions

No Upcoming Board Meetings

Standard Industries Ltd has declared 11% dividend, ex-date: 20 Feb 26

No Splits history available

No Bonus history available

No Rights history available
Quality key factors
Valuation key factors
Technicals key factors
 Technical Indicator Scale: Bearish, Mildly Bearish, Sideways, Mildly Bullish, Bullish Turned
 Shareholding Snapshot : Dec 2025
Shareholding Compare (%holding)
FIIs
None
Held by 11 Schemes (0.1%)
Held by 1 FIIs (38.86%)
Stanrose Mafatlal Investments & Finance Limited (19.44%)
Satin Limited (38.86%)
31.37%
Quarterly Results Snapshot (Consolidated) - Dec'25 - QoQ

QoQ Growth in quarter ended Dec 2025 is 21.16% vs -39.18% in Sep 2025
QoQ Growth in quarter ended Dec 2025 is 30.53% vs -551.96% in Sep 2025
Half Yearly Results Snapshot (Consolidated) - Sep'25
Growth in half year ended Sep 2025 is 48.46% vs -22.76% in Sep 2024

Growth in half year ended Sep 2025 is -122.97% vs 54.07% in Sep 2024
Nine Monthly Results Snapshot (Consolidated) - Dec'25
YoY Growth in nine months ended Dec 2025 is 28.92% vs -4.55% in Dec 2024
YoY Growth in nine months ended Dec 2025 is -35.65% vs 10.47% in Dec 2024
Annual Results Snapshot (Consolidated) - Mar'25
YoY Growth in year ended Mar 2025 is 3.79% vs 26.71% in Mar 2024
YoY Growth in year ended Mar 2025 is -10,292.31% vs -100.60% in Mar 2024
About Standard Industries Ltd

Company Coordinates


