
Compare Nagreeka Exports with Similar Stocks
Dashboard
Weak Long Term Fundamental Strength with an average Return on Capital Employed (ROCE) of 5.03%
- Poor long term growth as Net Sales has grown by an annual rate of 5.83% over the last 5 years
- Low ability to service debt as the company has a high Debt to EBITDA ratio of 6.99 times
Flat results in Mar 26
Consistent Underperformance against the benchmark over the last 3 years
Stock DNA
Garments & Apparels
INR 85 Cr (Micro Cap)
29.00
21
0.00%
1.09
1.97%
0.57
Total Returns (Price + Dividend) 
Latest dividend: 0.5 per share ex-dividend date: Sep-02-2014
Risk Adjusted Returns v/s
Returns Beta

News
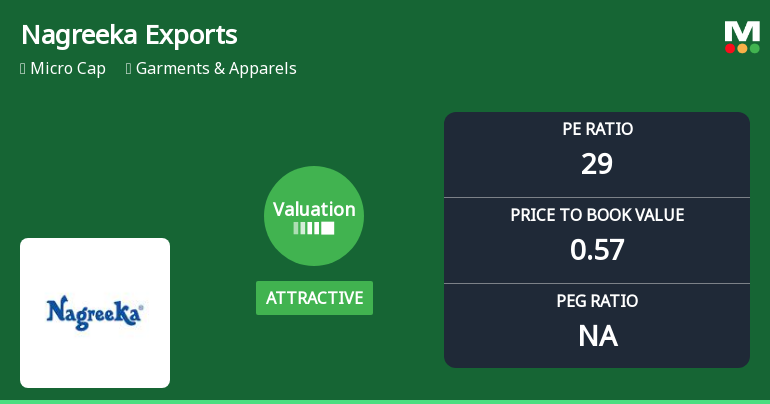
Nagreeka Exports Ltd Valuation Shifts Signal Renewed Price Attractiveness
Nagreeka Exports Ltd, a micro-cap player in the Garments & Apparels sector, has witnessed a notable shift in its valuation parameters, moving from very attractive to attractive territory. Despite a recent downgrade in its Mojo Grade to Strong Sell, the company’s price-to-earnings (P/E) and price-to-book value (P/BV) ratios suggest a more appealing price point relative to its historical averages and peer group. This article analyses the valuation changes, market performance, and comparative metrics to provide a comprehensive view for investors.
Read full news articleAre Nagreeka Exports Ltd latest results good or bad?
Nagreeka Exports Ltd's latest financial results for Q4 FY26 reveal a complex operational landscape characterized by significant revenue growth but troubling profitability metrics. The company reported net sales of ₹170.10 crores, which reflects a robust quarter-on-quarter growth of 33.12% and a year-on-year increase of 47.23%. This marks the highest quarterly revenue in the company's recent history, indicating strong top-line performance. However, this revenue growth has not translated into sustainable profitability. The operating profit margin fell sharply to 1.42%, a seven-quarter low, down from 4.31% in the previous quarter. This decline raises concerns about the company's pricing power and cost management. Additionally, net profit decreased to ₹0.43 crores, representing a 30.65% decline from the prior quarter, highlighting ongoing challenges in converting sales into profit. The company's profit after ...
Read full news article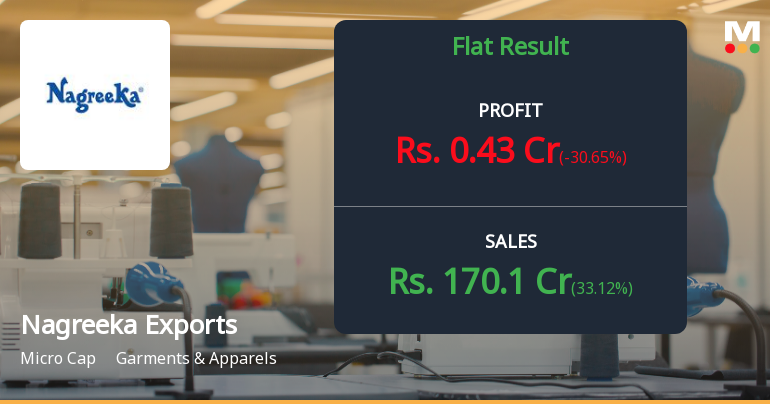
Nagreeka Exports Q4 FY26: Revenue Surge Masks Profitability Pressures
Nagreeka Exports Ltd., a Kolkata-based garments and apparels manufacturer with a market capitalisation of ₹90.00 crores, reported a concerning profit decline in Q4 FY26 despite posting its highest-ever quarterly revenue. Net profit plunged 30.65% quarter-on-quarter to ₹0.43 crores, whilst revenue surged 33.12% to ₹170.10 crores, exposing significant margin compression that has left investors questioning the quality of the company's growth trajectory.
Read full news article Announcements
Nagreeka Exports Limited - Clarification
18-Nov-2019 | Source : NSENagreeka Exports Limited with respect to announcement dated 14-Nov-2019, regarding Appointment of Mr Tushar Jhunjhunwala as Independent Director of the company w.e.f. November 14, 2019. On basis of above the Company is required to clarify following: 1. Brief profile. The response of the Company is awaited.
Nagreeka Exports Limited - Outcome of Board Meeting
15-Nov-2019 | Source : NSENagreeka Exports Limited has informed the Exchange regarding Board meeting held on November 14, 2019.
Nagreeka Exports Limited - Shareholders meeting
25-Oct-2019 | Source : NSENagreeka Exports Limited has informed the Exchange with copy of minutes of Annual General Meeting held on September 27, 2019
Corporate Actions

No Upcoming Board Meetings

Nagreeka Exports Ltd has declared 10% dividend, ex-date: 02 Sep 14

Nagreeka Exports Ltd has announced 5:10 stock split, ex-date: 22 Mar 07

No Bonus history available

Nagreeka Exports Ltd has announced 3:2 rights issue, ex-date: 30 Jan 24
Quality key factors
Valuation key factors
Technicals key factors
 Technical Indicator Scale: Bearish, Mildly Bearish, Sideways, Mildly Bullish, Bullish Turned
 Shareholding Snapshot : Mar 2026
Shareholding Compare (%holding)
Promoters
None
Held by 3 Schemes (0.01%)
Held by 0 FIIs
Sushil Patwari (31.36%)
Sri Krishna Viniyog Private Limited (4.78%)
21.45%
Quarterly Results Snapshot (Standalone) - Mar'26 - QoQ

QoQ Growth in quarter ended Mar 2026 is 33.12% vs 3.89% in Dec 2025
QoQ Growth in quarter ended Mar 2026 is -30.65% vs -43.12% in Dec 2025
Half Yearly Results Snapshot (Standalone) - Sep'25

Growth in half year ended Sep 2025 is -30.84% vs 15.16% in Sep 2024
Growth in half year ended Sep 2025 is -19.92% vs -25.52% in Sep 2024
Nine Monthly Results Snapshot (Standalone) - Dec'25
YoY Growth in nine months ended Dec 2025 is -17.48% vs -1.59% in Dec 2024
YoY Growth in nine months ended Dec 2025 is -22.19% vs -0.59% in Dec 2024
Annual Results Snapshot (Standalone) - Mar'26
YoY Growth in year ended Mar 2026 is -3.34% vs -5.40% in Mar 2025
YoY Growth in year ended Mar 2026 is -3.16% vs -47.42% in Mar 2025
About Nagreeka Exports Ltd

Company Coordinates


