Genus Paper & Bo

  • Market Cap: Micro Cap
  • Industry: Paper, Forest & Jute Products
  • ISIN: INE949P01018
  • NSEID: GENUSPAPER
  • BSEID: 538961
INR
12.02
0.03 (0.25%)
BSENSE

Sep 02, 10:17 AM

BSE+NSE Vol: 6.0 k

  • Price Points
  • Score
  • Mojo Parameters
  • Total Return
  • News and Corporate Actions
  • Key factors
  • Shareholding
  • Financials
  • CompanyCV
stock-summaryPrice Point
High/Low

1Day

52 Week

Valuation
Technical
Day's Volume

CASH

6.0 k (-76.91%) Volume

Shareholding (Jun 2026)

FII

0.00%

Held by 0 FIIs

DII

0.04%

Held by 0 DIIs

Promoter

50.84%

Why is Genus Paper & Boards Ltd falling/rising?

02-Sep-2026

As of 01-Sep, Genus Paper & Boards Ltd's stock price is at 12.00, reflecting a decline of -0.58%. The stock has underperformed significantly over the past year and three years, facing challenges such as high debt ratios and falling net sales, leading to cautious investor sentiment.

As of 01-Sep, Genus Paper & Boards Ltd's stock price is falling, currently at 12.00, reflecting a change of -0.07 (-0.58%). The stock has been on a downward trend, having lost -3.3% over the last three days. This decline is further evidenced by its performance today, where it underperformed its sector by -2.59%. <BR><BR>In terms of broader performance, the stock has generated a significant return of -34.57% over the past year, which is notably worse than the BSE500 index. Additionally, the stock has underperformed in the longer term, with a -36.07% return over the last three years compared to a +17.67% return for the benchmark. <BR><BR>The company is facing challenges such as a high Debt to EBITDA ratio of 5.60 times, indicating a low ability to service debt, and a debt-equity ratio that is the highest at 0.87 times. Furthermore, net sales have fallen by -6.9% compared to the previous quarter's average, contributing to a perception of weak long-term fundamental strength. <BR><BR>Despite a very attractive valuation with a ROCE of 5.4 and a PEG ratio of 0.7, the stock's poor performance in both the near and long term, alongside falling investor participation—evidenced by a -68.25% drop in delivery volume—suggests that investors are cautious, leading to the current decline in stock price.

View full answer

Who are in the management team of Genus Paper & Bo?

01-Sep-2026

The management team of Genus Paper & Bo includes Ishwar Chand Agarwal (Chairman), Kailash Chandra Agarwal (Managing Director), and several other directors, both executive and independent, responsible for the company's operations and strategic direction.

The management team of Genus Paper & Bo includes the following individuals:<BR><BR>1. **Ishwar Chand Agarwal** - Chairman (Non-Executive)<BR>2. **Himanshu Aggarwal** - Executive Director<BR>3. **Kailash Chandra Agarwal** - Managing Director<BR>4. **Udit Agarwal** - Independent Director<BR>5. **Rajendra Aggarwal** - Independent Director<BR>6. **Surya Prakash Sinha** - Executive Director<BR>7. **Anu Sharma** - Independent Director<BR>8. **Pradeep Narain Tandon** - Independent Director<BR>9. **Dharam Chand Agarwal** - Independent Director<BR>10. **Akhilesh Kumar Maheshwari** - Executive Director<BR>11. **Rekha Srivastava** - Additional Independent Director<BR>12. **Kunal Nayar** - Company Secretary & Compliance Officer<BR><BR>This team is responsible for overseeing the operations and strategic direction of the company.

View full answer

What does Genus Paper & Bo do?

01-Sep-2026

Genus Paper & Boards Ltd is a micro-cap company specializing in industrial Kraft paper production, with a market cap of INR 319 Cr and reported net sales of 219 Cr and net profit of 4 Cr for June 2026. The company has a P/E ratio of 34.00 and a debt-equity ratio of 0.79.

Overview:<BR>Genus Paper & Boards Ltd is a micro-cap company operating in the Paper, Forest & Jute Products industry, specializing in the production of industrial Kraft paper.<BR><BR>History:<BR>The company was incorporated in 1996 as DSM Paper Limited and underwent several name changes, becoming Kailash Paper Product Limited in 2002 and then Genus Paper Products Limited in 2006. The latest quarterly results reported net sales and profit for June 2026.<BR><BR>Financial Snapshot:<BR>- Net Sales: 219 Cr (Quarterly Results - Jun 2026)<BR>- Net Profit: 4 Cr (Quarterly Results - Jun 2026)<BR>- Market Cap: INR 319 Cr (Micro Cap)<BR><BR>Key Metrics:<BR>- P/E: 34.00<BR>- Industry P/E: 15<BR>- Dividend Yield: 0.00%<BR>- Debt-Equity: 0.79<BR>- Return on Equity: 1.80%<BR>- Price to Book: 0.61<BR><BR>Contact Details:<BR>Address: Genus Paper & Boards Ltd, Villg Aghwanpur Kanth Road Moradabad Uttar Pradesh : 244001<BR>Tel: 91-591-2511171<BR>Fax: 91-591-2511242<BR>Website: http://www.genuspaper.com

View full answer

Who are the peers of the Genus Paper & Bo?

01-Sep-2026

Genus Paper & Bo's peers include Satia Industries, Shree Rama News, Pakka, Orient Paper, Ludlow Jute, Ruchira Papers, Sh. Ajit Pulp, Star Paper Mills, and S I Paper Mills. In terms of management risk, Ruchira Papers is rated excellent, while others vary from average to below average; Genus Paper & Bo has a 1-year return of -32.46%, better than Pakka's -47.78% but worse than S I Paper Mills' 47.02%.

Peers: The peers of Genus Paper & Bo are Satia Industries, Shree Rama News., Pakka, Orient Paper, Ludlow Jute, Ruchira Papers, Sh. Ajit Pulp, Star Paper Mills, S I Paper Mills.<BR><BR>Quality Snapshot: Excellent management risk is observed at Ruchira Papers, while Average management risk is found at Satia Industries and Pakka, and the rest. Below Average management risk is present at Shree Rama News., Orient Paper, Ludlow Jute, Genus Paper & Bo, Sh. Ajit Pulp, and Star Paper Mills. Growth ratings show that Ruchira Papers has Below Average growth, while Satia Industries, Pakka, Orient Paper, Ludlow Jute, Genus Paper & Bo, Sh. Ajit Pulp, and Star Paper Mills also exhibit Below Average growth, and the rest. Good capital structure is noted at Satia Industries and Ruchira Papers, while Average capital structure is found at Pakka, Orient Paper, Ludlow Jute, Genus Paper & Bo, Sh. Ajit Pulp, Star Paper Mills, and S I Paper Mills, and the rest.<BR><BR>Return Snapshot: The peer with the highest 1-year return is S I Paper Mills at 47.02%, while Pakka has the lowest at -47.78%. Genus Paper & Bo's 1-year return of -32.46% is better than Pakka's but worse than S I Paper Mills. Additionally, the six-month return is negative for Satia Industries, Pakka, Orient Paper, and Ludlow Jute.

View full answer

How big is Genus Paper & Bo?

01-Sep-2026

As of 31st August, Genus Paper & Boards Ltd has a market capitalization of 319.00 Cr, with recent net sales of 965.67 Cr and a net profit of 9.42 Cr. Shareholder's funds are 515.37 Cr, and total assets amount to 1,085.04 Cr.

As of 31st August, Genus Paper & Boards Ltd has a market capitalization of 319.00 Cr, categorizing it as a Micro Cap company.<BR><BR>In the latest four quarters, the company reported Net Sales of 965.67 Cr and a Net Profit of 9.42 Cr.<BR><BR>The latest annual period for the balance sheet is March 2025, with Shareholder's Funds amounting to 515.37 Cr and Total Assets totaling 1,085.04 Cr.

View full answer

Should I buy, sell or hold Genus Paper & Boards Ltd?

01-Sep-2026

When is the next results date for Genus Paper & Boards Ltd?

04-Aug-2026

The next results date for Genus Paper & Boards Ltd is 11 August 2026.

The next results date for Genus Paper & Boards Ltd is scheduled for 11 August 2026.

View full answer

Are Genus Paper & Boards Ltd latest results good or bad?

14-Feb-2026

Genus Paper & Boards Ltd's latest results show a year-on-year profit increase to ₹9.44 crores, but a 24.61% decline in Q3 net profit and revenue contraction raise concerns about margins and debt management, indicating mixed overall performance.

The latest results for Genus Paper & Boards Ltd present a mixed picture. On one hand, the company has shown a significant year-on-year improvement in net profit, reporting ₹9.44 crores for the nine-month FY26 period, a substantial increase from ₹2.95 crores in the same period last year. This reflects a strong turnaround in profitability.<BR><BR>However, there are notable concerns. The company's net profit for Q3 FY26 decreased by 24.61% quarter-on-quarter to ₹2.88 crores, indicating a decline in performance compared to the previous quarter. Additionally, revenue also fell by 2.85% from the previous quarter, marking the second consecutive quarter of revenue contraction. The operating margin has compressed to 7.7%, down from 9.1% in the prior quarter, suggesting challenges in maintaining profitability amidst rising costs.<BR><BR>Moreover, the company's interest coverage ratio has deteriorated to 1.61 times, the lowest in eight quarters, raising concerns about its ability to service debt. The elevated debt levels and poor return on equity (1.64%) further complicate the outlook.<BR><BR>In summary, while there are positive signs in terms of year-on-year profit growth, the recent quarter's performance shows significant weaknesses, particularly in margins and debt management, which could pose challenges for sustained profitability moving forward.

View full answer

Is Genus Paper & Bo overvalued or undervalued?

20-Nov-2025

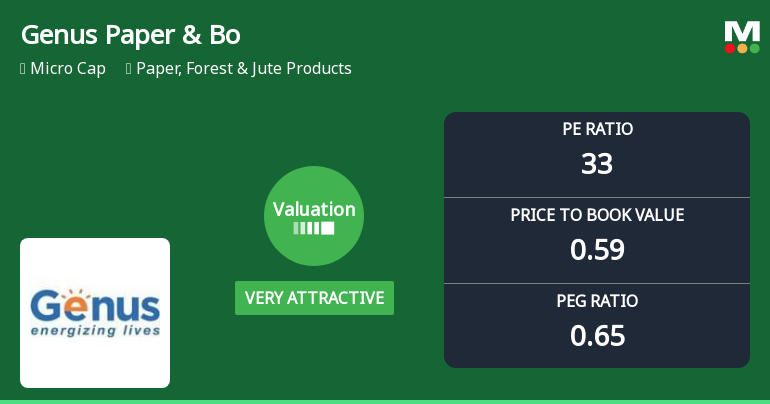
As of November 19, 2025, Genus Paper & Bo is considered very attractive and undervalued compared to peers, with a high PE Ratio of 53.06, an EV to EBITDA of 10.25, and a low Price to Book Value of 0.72, despite a year-to-date return of -32.86% against the Sensex's 9.02%.

As of 19 November 2025, the valuation grade for Genus Paper & Bo has moved from attractive to very attractive. The company is currently considered undervalued, particularly in comparison to its peers. Key ratios include a PE Ratio of 53.06, an EV to EBITDA of 10.25, and a PEG Ratio of 0.35, which suggests strong growth potential relative to its price.<BR><BR>In terms of peer comparison, Genus Paper & Bo's PE Ratio significantly exceeds that of JK Paper, which stands at 21.09, while its EV to EBITDA is higher than West Coast Paper's 5.68. Despite the high PE Ratio, the low Price to Book Value of 0.72 indicates that the stock may be undervalued in the market. The recent stock performance shows a decline compared to the Sensex, with a YTD return of -32.86% versus the Sensex's 9.02%, reinforcing the notion that the stock may be undervalued given its growth prospects.

View full answer

How has been the historical performance of Genus Paper & Bo?

13-Nov-2025

Genus Paper & Bo's historical performance shows increased net sales and operating income, rising to 863.25 Cr in Mar'25, but faced challenges with surging raw material costs and declining profit after tax, which fell to 2.93 Cr. Total assets grew to 1,085.04 Cr, while cash flow from operations decreased to 40.00 Cr, indicating a tightening cash position.

Answer:<BR>The historical performance of Genus Paper & Bo shows a fluctuating trend in key financial metrics over the years. <BR><BR>Breakdown:<BR>In terms of net sales, Genus Paper & Bo reported an increase from 711.84 Cr in Mar'24 to 863.25 Cr in Mar'25, following a dip to 721.65 Cr in Mar'23. The total operating income also rose to 863.25 Cr in Mar'25 from 711.84 Cr in the previous year. However, raw material costs surged significantly, reaching 634.20 Cr in Mar'25, up from 477.13 Cr in Mar'24. Operating profit before depreciation and interest (PBDIT) increased to 69.97 Cr in Mar'25, compared to 60.57 Cr in Mar'24, while profit before tax remained relatively stable at 2.90 Cr in Mar'25, slightly down from 2.92 Cr in Mar'24. The profit after tax showed a decline to 2.93 Cr in Mar'25 from 3.46 Cr in Mar'24, reflecting a challenging profitability environment. On the balance sheet, total assets grew to 1,085.04 Cr in Mar'25 from 979.30 Cr in Mar'24, with total liabilities also increasing to 1,085.04 Cr. Cash flow from operating activities decreased to 40.00 Cr in Mar'25 from 73.00 Cr in Mar'24, indicating a tightening cash position. Overall, while sales and operating income improved, rising costs and fluctuating profits highlight the challenges faced by the company.

View full answer

Is Genus Paper & Bo technically bullish or bearish?

18-Jul-2025

As of July 17, 2025, Genus Paper & Bo's technical trend has shifted to neutral, with mixed signals indicating a balance between mildly bullish and bearish indicators across various time frames.

As of 17 July 2025, the technical trend for Genus Paper & Bo has changed from mildly bullish to sideways. The current technical stance is neutral, with mixed signals across various indicators. The weekly MACD is mildly bullish, while the monthly MACD is mildly bearish. The weekly RSI is bearish, and the daily moving averages indicate a mildly bearish trend. Bollinger Bands show a mildly bullish stance on the weekly chart but are mildly bearish on the monthly. KST is bullish weekly but bearish monthly, and Dow Theory remains mildly bullish on both time frames. Overall, the strength of the bullish signals is being offset by bearish indicators, leading to a neutral outlook.

View full answer

Who are the top shareholders of the Genus Paper & Bo?

06-Jun-2025

The top shareholders of Genus Paper & Bo include Hi - Print Electromack Private Limited with 18.4%, Vikas Kothari as trustee for the Genus Shareholders' Trust with 18.49%, and individual investors holding 43.64% of the shares. Mutual funds and foreign institutional investors hold a small percentage of the remaining shares.

The top shareholders of Genus Paper & Bo include a mix of promoters and individual investors. The majority shareholders are the promoters, with Hi - Print Electromack Private Limited holding the largest stake at 18.4%. Additionally, Vikas Kothari, acting as the trustee for the Genus Shareholders' Trust, is the highest public shareholder with a holding of 18.49%. Individual investors collectively hold 43.64% of the shares. There are also some holdings from mutual funds and foreign institutional investors, but these represent a very small percentage of the total shares.

View full answer

Has Genus Paper & Bo declared dividend?

06-Jun-2025

No Dividend History Available

iScoreScore
Click here to find our call on this stock
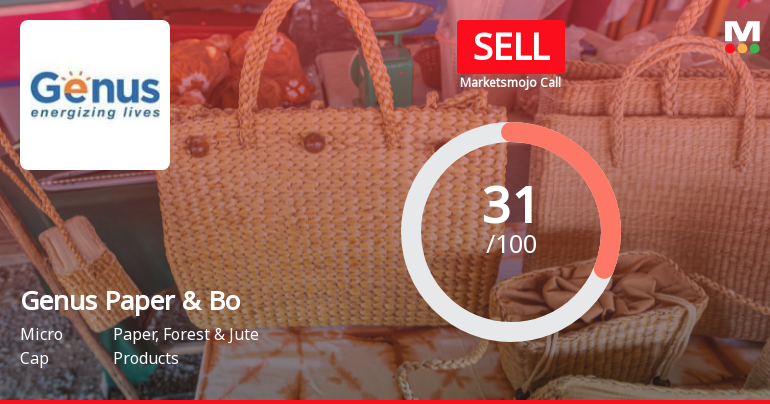
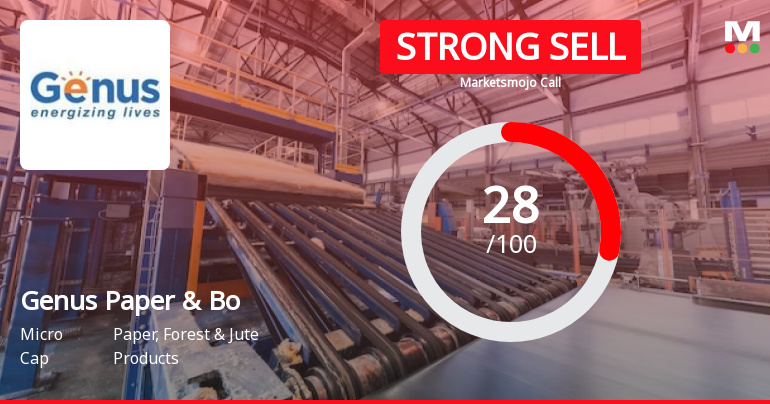
Strong Sell
Sell
Hold
Buy
Strong Buy

Dashboard

1

Weak Long Term Fundamental Strength with an average Return on Capital Employed (ROCE) of 4.25%

  • Poor long term growth as Operating profit has grown by an annual rate 19.59% of over the last 5 years
  • Low ability to service debt as the company has a high Debt to EBITDA ratio of 5.60 times
2

Flat results in Jun 26

3

Below par performance in long term as well as near term

stock-summaryMojo Parameters

Mojo Parameters

Loading Valuation Snapshot...

Stock DNA

stock-summary
Industry

Paper, Forest & Jute Products

stock-summary
Market cap

INR 309 Cr (Micro Cap)

stock-summary
P/E

33.00

stock-summary
Industry P/E

15

stock-summary
Dividend Yield

0.00%

stock-summary
Debt Equity

0.79

stock-summary
Return on Equity

1.80%

stock-summary
Price to Book

0.59

Revenue and Profits:
Net Sales:
219 Cr
(Quarterly Results - Jun 2026)
Net Profit:
4 Cr
stock-summaryTotal Returns
Total Returns (Price + Dividend) stock-summary
Dividend Yield (0%)
TimePeriod
Price Return
Dividend Return
Total Return
3 Months
-3.61%
0%
-3.61%
6 Months
-0.91%
0%
-0.91%
1 Year
-35.1%
0%
-35.1%
2 Years
-54.3%
0%
-54.3%
3 Years
-36.23%
0%
-36.23%
4 Years
-28.88%
0%
-28.88%
5 Years
22.03%
0%
22.03%

Genus Paper & Bo for the last several years.

Risk Adjusted Returns v/s stock-summary
Returns Beta
Icon
Beta has not been calculated since enough price history is not available
stock-summaryNews & Corporate Actions

Announcements stock-summary

Genus Paper & Boards Limited - Updates

01-Nov-2019 | Source : NSE

Genus Paper & Boards Limited has informed the Exchange regarding ''.

Genus Paper & Boards Limited - Updates

09-Oct-2019 | Source : NSE

Genus Paper & Boards Limited has informed the Exchange regarding ''.

Updates

07-Sep-2019 | Source : NSE

Genus Paper & Boards Limited has informed the Exchange regarding ''.

Corporate Actions stock-summary

stock-summary
BOARD MEETING

25 Sep 2026

stock-summary
DIVIDEND

No Dividend history available

stock-summary
SPLITS

No Splits history available

stock-summary
BONUS

No Bonus history available

stock-summary
RIGHTS

No Rights history available

stock-summaryKey Factors

Quality key factors stock-summary

Factor
Value
Sales Growth (5y)
21.77%
EBIT Growth (5y)
19.59%
EBIT to Interest (avg)
1.89
Debt to EBITDA (avg)
6.48
Net Debt to Equity (avg)
0.79
Sales to Capital Employed (avg)
0.90
Tax Ratio
Tax Ratio is Negative%
Dividend Payout Ratio
0
Pledged Shares
0
Institutional Holding
0.04%
ROCE (avg)
3.76%
ROE (avg)
1.75%

Valuation key factors

Factor
Value
P/E Ratio
33
Industry P/E
15
Price to Book Value
0.59
EV to EBIT
14.31
EV to EBITDA
9.24
EV to Capital Employed
0.77
EV to Sales
0.75
PEG Ratio
0.65
Dividend Yield
NA
ROCE (Latest)
5.39%
ROE (Latest)
1.80%

Technicals key factors

Indicator
Weekly
Monthly
MACD
Mildly Bullish
Bearish
RSI
No Signal
No Signal
Bollinger Bands
Bearish
Bearish
Moving Averages
Mildly Bearish (Daily)
KST
Bearish
Bearish
Dow Theory
No Trend
No Trend
OBV
No Trend
No Trend
stock-summary Technical Indicator Scale: Bearish, Mildly Bearish, Sideways, Mildly Bullish, Bullish  Turned 
stock-summaryShareholding
Shareholding Snapshot : Jun 2026stock-summary
Shareholding Compare (%holding) stock-summary
Majority shareholders

Promoters

Pledged Promoter Holdings

None

Mutual Funds

Held by 6 Schemes (0.04%)

FIIs

Held by 0 FIIs

Promoter with highest holding

Hi - Print Electromack Private Limited (18.4%)

Highest Public shareholder

Vikas Kothari (trustee: Genus Shareholders' Trust) (18.49%)

Individual Investors Holdings

44.09%

stock-summaryFinancial
[
  {
    "link": "quarterly",
    "btn_text": "All Quarterly Results",
    "header": "Quarterly Results Snapshot (Standalone) - Jun'26 - QoQ",
    "rhs": [
      {
        "prefix": "Net Sales ",
        "suffix": "QoQ Growth in quarter ended Jun 2026 is -3.26% vs 2.44% in Mar 2026",
        "dir": -1
      },
      {
        "prefix": "Standalone Net Profit ",
        "suffix": "QoQ Growth in quarter ended Jun 2026 is -7.37% vs 78.40% in Mar 2026",
        "dir": -1
      }
    ],
    "table": {
      "header": [
        "Jun'26",
        "Mar'26",
        "Change(%)"
      ],
      "body": [
        {
          "field": "Net Sales",
          "val1": "218.72",
          "val2": "226.09",
          "chgp": "-3.26%",
          "chgp_class": "negative"
        },
        {
          "field": "Operating Profit (PBDIT) excl Other Income",
          "val1": "18.96",
          "val2": "19.01",
          "chgp": "-0.26%",
          "chgp_class": "negative"
        },
        {
          "field": "Interest",
          "val1": "10.51",
          "val2": "10.77",
          "chgp": "-2.41%",
          "chgp_class": "positive"
        },
        {
          "field": "Exceptional Items",
          "val1": "0.00",
          "val2": "0.00",
          "chgp": "",
          "chgp_class": "neutral"
        },
        {
          "field": "Standalone Net Profit",
          "val1": "3.52",
          "val2": "3.80",
          "chgp": "-7.37%",
          "chgp_class": "negative"
        },
        {
          "field": "Operating Profit Margin (Excl OI)",
          "val1": "8.67%",
          "val2": "8.41%",
          "chgp": "0.26%",
          "chgp_class": "positive"
        }
      ]
    }
  },
  {
    "link": "half-yearly",
    "btn_text": "All Half Yearly Results",
    "header": "Half Yearly Results Snapshot (Consolidated) - Sep'25",
    "rhs": [
      {
        "prefix": "Net Sales ",
        "suffix": " Growth in half year ended Sep 2025 is 18.49% vs 13.38% in Sep 2024",
        "dir": 1
      },
      {
        "prefix": "Consolidated Net Profit ",
        "suffix": " Growth in half year ended Sep 2025 is 173.33% vs -22.33% in Sep 2024",
        "dir": 1
      }
    ],
    "table": {
      "header": [
        "Sep'25",
        "Sep'24",
        "Change(%)"
      ],
      "body": [
        {
          "field": "Net Sales",
          "val1": "499.95",
          "val2": "421.95",
          "chgp": "18.49%",
          "chgp_class": "positive"
        },
        {
          "field": "Operating Profit (PBDIT) excl Other Income",
          "val1": "42.42",
          "val2": "33.71",
          "chgp": "25.84%",
          "chgp_class": "positive"
        },
        {
          "field": "Interest",
          "val1": "21.31",
          "val2": "18.59",
          "chgp": "14.63%",
          "chgp_class": "negative"
        },
        {
          "field": "Exceptional Items",
          "val1": "0.00",
          "val2": "0.00",
          "chgp": "",
          "chgp_class": "neutral"
        },
        {
          "field": "Consolidate Net Profit",
          "val1": "6.56",
          "val2": "2.40",
          "chgp": "173.33%",
          "chgp_class": "positive"
        },
        {
          "field": "Operating Profit Margin (Excl OI)",
          "val1": "8.48%",
          "val2": "7.99%",
          "chgp": "0.49%",
          "chgp_class": "positive"
        }
      ]
    }
  },
  {
    "link": "nine-monthly",
    "btn_text": "All Nine Monthly Results",
    "header": "Nine Monthly Results Snapshot (Consolidated) - Dec'25",
    "rhs": [
      {
        "prefix": "Net Sales ",
        "suffix": "YoY Growth in nine months ended Dec 2025 is 16.13% vs 20.41% in Dec 2024",
        "dir": -1
      },
      {
        "prefix": "Consolidated Net Profit ",
        "suffix": "YoY Growth in nine months ended Dec 2025 is 221.09% vs -2.00% in Dec 2024",
        "dir": 1
      }
    ],
    "table": {
      "header": [
        "Dec'25",
        "Dec'24",
        "Change(%)"
      ],
      "body": [
        {
          "field": "Net Sales",
          "val1": "737.47",
          "val2": "635.04",
          "chgp": "16.13%",
          "chgp_class": "positive"
        },
        {
          "field": "Operating Profit (PBDIT) excl Other Income",
          "val1": "60.70",
          "val2": "50.81",
          "chgp": "19.46%",
          "chgp_class": "positive"
        },
        {
          "field": "Interest",
          "val1": "32.67",
          "val2": "28.43",
          "chgp": "14.91%",
          "chgp_class": "negative"
        },
        {
          "field": "Exceptional Items",
          "val1": "0.00",
          "val2": "0.00",
          "chgp": "",
          "chgp_class": "neutral"
        },
        {
          "field": "Consolidate Net Profit",
          "val1": "9.44",
          "val2": "2.94",
          "chgp": "221.09%",
          "chgp_class": "positive"
        },
        {
          "field": "Operating Profit Margin (Excl OI)",
          "val1": "8.23%",
          "val2": "8.00%",
          "chgp": "0.23%",
          "chgp_class": "positive"
        }
      ]
    }
  },
  {
    "link": "annual",
    "btn_text": "All Annual Results",
    "header": "Annual Results Snapshot (Standalone) - Mar'26",
    "rhs": [
      {
        "prefix": "Net Sales ",
        "suffix": "YoY Growth in year ended Mar 2026 is 10.70% vs 30.43% in Mar 2025",
        "dir": -1
      },
      {
        "prefix": "Standalone Net Profit ",
        "suffix": "YoY Growth in year ended Mar 2026 is 80.45% vs 42.76% in Mar 2025",
        "dir": 1
      }
    ],
    "table": {
      "header": [
        "Mar'26",
        "Mar'25",
        "Change(%)"
      ],
      "body": [
        {
          "field": "Net Sales",
          "val1": "939.97",
          "val2": "849.15",
          "chgp": "10.70%",
          "chgp_class": "positive"
        },
        {
          "field": "Operating Profit (PBDIT) excl Other Income",
          "val1": "79.10",
          "val2": "68.09",
          "chgp": "16.17%",
          "chgp_class": "positive"
        },
        {
          "field": "Interest",
          "val1": "41.39",
          "val2": "35.46",
          "chgp": "16.72%",
          "chgp_class": "negative"
        },
        {
          "field": "Exceptional Items",
          "val1": "0.00",
          "val2": "0.00",
          "chgp": "",
          "chgp_class": "neutral"
        },
        {
          "field": "Standalone Net Profit",
          "val1": "14.58",
          "val2": "8.08",
          "chgp": "80.45%",
          "chgp_class": "positive"
        },
        {
          "field": "Operating Profit Margin (Excl OI)",
          "val1": "8.42%",
          "val2": "8.02%",
          "chgp": "0.40%",
          "chgp_class": "positive"
        }
      ]
    }
  }
]

Quarterly Results Snapshot (Standalone) - Jun'26 - QoQstock-summary

Jun'26
Mar'26
Change(%)
Net Sales
218.72
226.09
-3.26%
Operating Profit (PBDIT) excl Other Income
18.96
19.01
-0.26%
Interest
10.51
10.77
-2.41%
Exceptional Items
0.00
0.00
Standalone Net Profit
3.52
3.80
-7.37%
Operating Profit Margin (Excl OI)
8.67%
8.41%
0.26%
Values in Rs Cr.
Direction Arrows
Net Sales

QoQ Growth in quarter ended Jun 2026 is -3.26% vs 2.44% in Mar 2026

Direction Arrows
Standalone Net Profit

QoQ Growth in quarter ended Jun 2026 is -7.37% vs 78.40% in Mar 2026

Half Yearly Results Snapshot (Consolidated) - Sep'25stock-summary

Sep'25
Sep'24
Change(%)
Net Sales
499.95
421.95
18.49%
Operating Profit (PBDIT) excl Other Income
42.42
33.71
25.84%
Interest
21.31
18.59
14.63%
Exceptional Items
0.00
0.00
Consolidate Net Profit
6.56
2.40
173.33%
Operating Profit Margin (Excl OI)
8.48%
7.99%
0.49%
Values in Rs Cr.
Direction Arrows
Net Sales

Growth in half year ended Sep 2025 is 18.49% vs 13.38% in Sep 2024

Direction Arrows
Consolidated Net Profit

Growth in half year ended Sep 2025 is 173.33% vs -22.33% in Sep 2024

Nine Monthly Results Snapshot (Consolidated) - Dec'25stock-summary

Dec'25
Dec'24
Change(%)
Net Sales
737.47
635.04
16.13%
Operating Profit (PBDIT) excl Other Income
60.70
50.81
19.46%
Interest
32.67
28.43
14.91%
Exceptional Items
0.00
0.00
Consolidate Net Profit
9.44
2.94
221.09%
Operating Profit Margin (Excl OI)
8.23%
8.00%
0.23%
Values in Rs Cr.
Direction Arrows
Net Sales

YoY Growth in nine months ended Dec 2025 is 16.13% vs 20.41% in Dec 2024

Direction Arrows
Consolidated Net Profit

YoY Growth in nine months ended Dec 2025 is 221.09% vs -2.00% in Dec 2024

Annual Results Snapshot (Standalone) - Mar'26stock-summary

Mar'26
Mar'25
Change(%)
Net Sales
939.97
849.15
10.70%
Operating Profit (PBDIT) excl Other Income
79.10
68.09
16.17%
Interest
41.39
35.46
16.72%
Exceptional Items
0.00
0.00
Standalone Net Profit
14.58
8.08
80.45%
Operating Profit Margin (Excl OI)
8.42%
8.02%
0.40%
Values in Rs Cr.
Direction Arrows
Net Sales

YoY Growth in year ended Mar 2026 is 10.70% vs 30.43% in Mar 2025

Direction Arrows
Standalone Net Profit

YoY Growth in year ended Mar 2026 is 80.45% vs 42.76% in Mar 2025

stock-summaryCompany CV
About Genus Paper & Boards Ltd stock-summary
stock-summary
Genus Paper & Boards Ltd
Micro Cap
Paper, Forest & Jute Products
Genus Paper & Boards Limited was incorporated as DSM Paper Limited in 1996. The Company name was then changed from DSM Paper Limited to Kailash Paper Product Limited in 2002 and from Kailash Paper Product Limited' to 'Genus Paper Products Limited' in 2006. The Company is an integral part of the Kailash Group, having its business into industrial Kraft paper. It has two manufacturing facilities at Moradabad and Muzaarnagar.
Company Coordinates stock-summary
Company Details
Genus Paper & Boards Ltd, Villg Aghwanpur Kanth Road Moradabad Uttar Pradesh : 244001
stock-summary
Tel: 91-591-2511171
stock-summary
Registrar Details
Niche Technologies Pvt Ltd , D-511, Bagree Market 5th Floor, 71 B R B B Road , Kolkata