
Compare Loyal Textile with Similar Stocks
Dashboard
With a Operating Losses, the company has a Weak Long Term Fundamental Strength
- Low ability to service debt as the company has a high Debt to EBITDA ratio of -8.13 times
- The company has been able to generate a Return on Equity (avg) of 5.51% signifying low profitability per unit of shareholders funds
Negative results in Mar 26
Risky - Negative EBITDA
Consistent Underperformance against the benchmark over the last 3 years
Stock DNA
Garments & Apparels
INR 100 Cr (Micro Cap)
NA (Loss Making)
25
0.00%
1.01
-26.98%
0.49
Total Returns (Price + Dividend) 
Latest dividend: 10.025433526011561 per share ex-dividend date: Sep-14-2022
Risk Adjusted Returns v/s
Returns Beta

News

Loyal Textile Mills Ltd is Rated Strong Sell
Loyal Textile Mills Ltd is rated Strong Sell by MarketsMOJO, with this rating last updated on 30 May 2023. However, the analysis and financial metrics presented here reflect the stock’s current position as of 16 June 2026, providing investors with an up-to-date view of the company’s performance and outlook.
Read full news article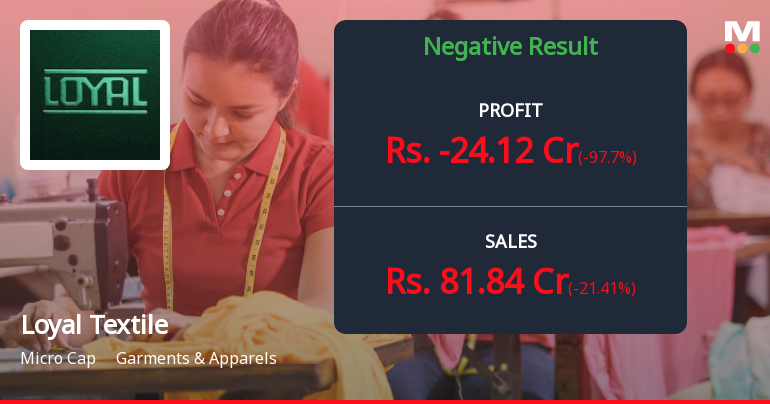
Loyal Textile Mills Q4 FY26: Losses Deepen as Revenue Plummets 41.5% YoY
Loyal Textile Mills Ltd., the Tamil Nadu-based textile manufacturer, reported a consolidated net loss of ₹24.12 crores for Q4 FY26, marking a sharp deterioration from the ₹39.35 crores profit recorded in Q4 FY25. The loss widened 97.70% sequentially from ₹12.20 crores in Q3 FY26, as the company grappled with a severe revenue contraction of 41.53% year-on-year to ₹81.84 crores. The stock, trading at ₹229.75 with a market capitalisation of ₹113.00 crores, has declined 22.63% over the past year, significantly underperforming the Sensex which fell 8.40% during the same period.
Read full news article
Loyal Textile Mills Ltd is Rated Strong Sell
Loyal Textile Mills Ltd is rated Strong Sell by MarketsMOJO, with this rating last updated on 30 May 2023. However, the analysis below reflects the stock’s current position as of 24 May 2026, incorporating the latest fundamentals, returns, and financial metrics to provide investors with an up-to-date perspective.
Read full news article Announcements
Corporate Actions

No Upcoming Board Meetings

Loyal Textile Mills Ltd has declared 100% dividend, ex-date: 14 Sep 22

No Splits history available

No Bonus history available

No Rights history available
Quality key factors
Valuation key factors
Technicals key factors
 Technical Indicator Scale: Bearish, Mildly Bearish, Sideways, Mildly Bullish, Bullish Turned
 Shareholding Snapshot : Mar 2026
Shareholding Compare (%holding)
Promoters
None
Held by 0 Schemes
Held by 0 FIIs
Madurai Tara Traders Private Limited (16.13%)
Mohan Gupta (2.8%)
20.65%
Quarterly Results Snapshot (Consolidated) - Mar'26 - QoQ

QoQ Growth in quarter ended Mar 2026 is -21.41% vs -2.25% in Dec 2025
QoQ Growth in quarter ended Mar 2026 is -97.70% vs -7.58% in Dec 2025
Half Yearly Results Snapshot (Consolidated) - Sep'25
Growth in half year ended Sep 2025 is -36.55% vs -28.62% in Sep 2024

Growth in half year ended Sep 2025 is 55.97% vs -168.85% in Sep 2024
Nine Monthly Results Snapshot (Consolidated) - Dec'25
YoY Growth in nine months ended Dec 2025 is -35.50% vs -27.34% in Dec 2024
YoY Growth in nine months ended Dec 2025 is 55.24% vs -246.69% in Dec 2024
Annual Results Snapshot (Consolidated) - Mar'26
YoY Growth in year ended Mar 2026 is -32.79% vs -33.16% in Mar 2025
YoY Growth in year ended Mar 2026 is -38.04% vs -18.61% in Mar 2025
About Loyal Textile Mills Ltd

Company Coordinates


