
Dashboard
With a Negative Book Value, the company has a Weak Long Term Fundamental Strength
- Poor long term growth as Net Sales has grown by an annual rate of -15.07% and Operating profit at 0% over the last 5 years
- High Debt Company with a Debt to Equity ratio (avg) at 0 times
The company has declared negative results for the last 4 consecutive quarters
Risky - Negative EBITDA
50.82% of Promoter Shares are Pledged
Underperformed the market in the last 1 year
Stock DNA
Media & Entertainment
INR 34 Cr (Micro Cap)
NA (Loss Making)
19
0.00%
-0.02
18.65%
-0.23
Total Returns (Price + Dividend) 
TV Vision for the last several years.
Risk Adjusted Returns v/s
Returns Beta

News

TV Vision Hits Lower Circuit Amid Heavy Selling Pressure and Panic Selling
TV Vision Ltd, a micro-cap player in the Media & Entertainment sector, witnessed a sharp decline on 29 Dec 2025 as its stock price hit the lower circuit limit, reflecting intense selling pressure and panic among investors. The stock closed at ₹8.72, marking a maximum daily loss of 4.91%, significantly underperforming its sector and broader market benchmarks.
Read More
TV Vision Ltd is Rated Strong Sell
TV Vision Ltd is rated Strong Sell by MarketsMOJO, with this rating last updated on 30 January 2025. However, the analysis and financial metrics discussed here reflect the stock's current position as of 26 December 2025, providing investors with an up-to-date view of the company’s fundamentals, returns, and market performance.
Read More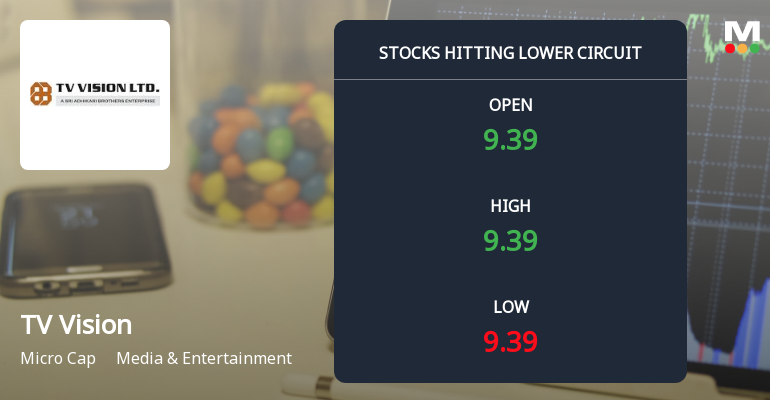
TV Vision Stock Hits Lower Circuit Amid Heavy Selling Pressure
Shares of TV Vision Ltd, a micro-cap player in the Media & Entertainment sector, plunged to their lower circuit limit on 26 Dec 2025, reflecting intense selling pressure and a sharp decline in investor confidence. The stock closed at ₹9.17, marking a maximum daily loss of 4.97%, as panic selling dominated trading activity.
Read More Announcements
TV Vision Limited - Outcome of Board Meeting
15-Nov-2019 | Source : NSETV Vision Limited has informed the Exchange regarding Board meeting held on November 14, 2019.
TV Vision Limited - Disclosure under SEBI Takeover Regulations
09-Oct-2019 | Source : NSEDisclosure under SEBI Takeover Regulations TVVISION : Markand Adhkari on behalf of Late Gautam Adhikari, GLobal Showbiz Private Ltd, Markand Adhikari has informed the Exchange regarding reason for encumbrance vide letter dated October 04, 2019 under SEBI ( SAST) Regulations, 2011.
Updates
09-Sep-2019 | Source : NSE
| TV Vision Limited has informed the Exchange regarding 'With reference to the above captioned subject and pursuant to Regulation 47 of the SEBI (Listing Obligations and Disclosure Requirements) Regulations, 2015, we wish to inform you that the Company has published the newspaper advertisement of the 12th Annual General Meeting in the following two newspapers:Financial Express (one English Newspaper)Mumbai Mitra (one Marathi Newspaper)The copy of newspaper advertisement is enclosed herewith for your records. Kindly acknowledge the receipt of the same.'. |
Corporate Actions

No Upcoming Board Meetings

No Dividend history available

No Splits history available

No Bonus history available

No Rights history available
Quality key factors
Valuation key factors
Technicals key factors
 Technical Indicator Scale: Bearish, Mildly Bearish, Sideways, Mildly Bullish, Bullish Turned
 Shareholding Snapshot : Sep 2025
Shareholding Compare (%holding)
Non Institution
50.8221
Held by 2 Schemes (0.0%)
Held by 2 FIIs (0.0%)
Sri Adhikari Brothers Assets Holding Private Limited (9.81%)
Aranav Trading And Investments Pvt Ltd (5.98%)
42.66%
Quarterly Results Snapshot (Consolidated) - Sep'25 - YoY

YoY Growth in quarter ended Sep 2025 is -52.86% vs -15.04% in Sep 2024
YoY Growth in quarter ended Sep 2025 is -89.56% vs 2.59% in Sep 2024
Half Yearly Results Snapshot (Consolidated) - Sep'25
Growth in half year ended Sep 2025 is -60.74% vs 8.95% in Sep 2024

Growth in half year ended Sep 2025 is -23.72% vs -30.95% in Sep 2024
Nine Monthly Results Snapshot (Consolidated) - Dec'24
YoY Growth in nine months ended Dec 2024 is 0.27% vs -18.90% in Dec 2023
YoY Growth in nine months ended Dec 2024 is -3.51% vs -27.39% in Dec 2023
Annual Results Snapshot (Consolidated) - Mar'25
YoY Growth in year ended Mar 2025 is -8.77% vs -18.11% in Mar 2024
YoY Growth in year ended Mar 2025 is -12.68% vs -18.95% in Mar 2024
About TV Vision Ltd

Company Coordinates


