Jindal Photo

INR
1,051.10
-0.1 (-0.01%)
BSENSE

Aug 26, 10:01 AM

BSE+NSE Vol: 151

  • Price Points
  • Score
  • Mojo Parameters
  • Total Return
  • News and Corporate Actions
  • Key factors
  • Shareholding
  • Financials
  • CompanyCV
stock-summaryPrice Point
High/Low

1Day

52 Week

Valuation
Technical
Day's Volume

CASH

151 (-73.26%) Volume

Shareholding (Jun 2026)

FII

0.00%

Held by 0 FIIs

DII

0.02%

Held by 0 DIIs

Promoter

74.20%

Why is Jindal Photo Ltd falling/rising?

26-Aug-2026

As of 25-Aug, Jindal Photo Ltd's stock price is rising to 1,050.00, marking a 3.54% increase and a trend reversal after five days of decline. Despite today's gains and increased investor interest, the stock remains below its key moving averages, indicating longer-term challenges.

As of 25-Aug, Jindal Photo Ltd's stock price is rising, currently at 1,050.00, reflecting an increase of 35.9 points or 3.54%. This upward movement is notable as it marks a trend reversal after five consecutive days of decline. The stock opened today with a gain of 3.54%, reaching an intraday high of Rs 1,050. Additionally, the stock has outperformed its sector by 3.42% today.<BR><BR>Investor participation has also increased, with a delivery volume of 5.64 k on 24 August, which is up by 221.62% compared to the 5-day average delivery volume. This surge in trading activity indicates growing interest among investors, contributing to the stock's rise. However, it is important to note that despite today's positive performance, Jindal Photo Ltd is currently trading below its 5-day, 20-day, 50-day, 100-day, and 200-day moving averages, suggesting that the stock has faced challenges in the longer term.

View full answer

Should I buy, sell or hold Jindal Photo Ltd?

15-Aug-2026

Who are in the management team of Jindal Photo?

14-Aug-2026

The management team of Jindal Photo includes Ashok Yadav (Company Secretary), Geeta Gilotra and Prakash Matai (Directors), Manoj Kumar Rastogi (Managing Director), and independent directors Vinumon Kizhakkeveetil Govindan and Radhey Shyam, with Suresh Chander Sharma serving as Chairman.

The management team of Jindal Photo includes the following individuals:<BR><BR>1. **Ashok Yadav** - Company Secretary & Compliance Officer<BR>2. **Geeta Gilotra** - Director<BR>3. **Vinumon Kizhakkeveetil Govindan** - Independent Director<BR>4. **Manoj Kumar Rastogi** - Managing Director<BR>5. **Radhey Shyam** - Independent Director<BR>6. **Prakash Matai** - Director<BR>7. **Suresh Chander Sharma** - Chairman & Independent Director<BR><BR>If you need more details about their roles or contributions, feel free to ask!

View full answer

What does Jindal Photo do?

14-Aug-2026

Jindal Photo Ltd is a leading Indian manufacturer of photographic products in the FMCG sector, with a market cap of INR 1,085 Cr. As of June 2026, it reported net sales of 8 Cr and a net profit of 13 Cr.

Overview:<BR>Jindal Photo Ltd is one of India's largest manufacturers of photographic and allied products, operating within the FMCG industry and classified as a micro-cap company.<BR><BR>History:<BR>The company was incorporated in an unspecified year, with its latest reported quarterly results for net sales and profit being for June 2026.<BR><BR>Financial Snapshot:<BR>Most recent Net Sales: 8 Cr (Quarterly Results - Jun 2026) <BR>Most recent Net Profit: 13 Cr (Quarterly Results - Jun 2026) <BR>Market-cap value: INR 1,085 Cr (Micro Cap)<BR><BR>Key Metrics:<BR>P/E: N/A <BR>Industry P/E: 31 <BR>Dividend Yield: 0.00% <BR>Debt-Equity: 0.06 <BR>Return on Equity: -2.23% <BR>Price to Book: 1.05<BR><BR>Contact Details:<BR>Address: 19th KM Hapur-Bulandshahr Road, P O Gulaothi Bulandshahr Uttar Pradesh : 203408 <BR>Email: cs_jphoto@jindalgroup.com <BR>Website: http://www.jindalphoto.com

View full answer

Who are the peers of the Jindal Photo?

14-Aug-2026

Jindal Photo's peers include SKM Egg Prod., Godavari Bioref., and Lotus Chocolate, among others. Jindal Photo shows good growth and a 1-year return of 30.84%, outperforming several peers with negative returns.

Peers: The peers of Jindal Photo are SKM Egg Prod., Godavari Bioref., Andrew Yule & Co, Apex Frozen Food, HMA Agro Inds., Vadilal Enterp., Lotus Chocolate, Freshara Agro, Anondita Medi.<BR><BR>Quality Snapshot: Excellent management risk is observed at Anondita Medi. Average management risk is found at SKM Egg Prod., Apex Frozen Food, HMA Agro Inds., Vadilal Enterp., and the rest. Below Average management risk is noted for Godavari Bioref., Andrew Yule & Co, and Lotus Chocolate. Growth is excellent at Jindal Photo, Vadilal Enterp., Freshara Agro, and Anondita Medi, while good growth is seen at SKM Egg Prod. Below Average growth is present at Godavari Bioref., Andrew Yule & Co, Apex Frozen Food, HMA Agro Inds., and Lotus Chocolate. Capital Structure is excellent at Anondita Medi, while Below Average capital structure is noted for Jindal Photo, Godavari Bioref., Andrew Yule & Co, HMA Agro Inds., and Freshara Agro, with Average capital structure at SKM Egg Prod., Apex Frozen Food, and Vadilal Enterp.<BR><BR>Return Snapshot: The peer with the highest 1-year return is SKM Egg Prod. at 49.01%, while the lowest is Lotus Chocolate at -45.92%. Jindal Photo's 1-year return of 30.84% is higher than that of Godavari Bioref., Andrew Yule & Co, HMA Agro Inds., Lotus Chocolate, and Freshara Agro, which all have negative six-month returns.

View full answer

How big is Jindal Photo?

14-Aug-2026

As of 14th August, Jindal Photo Ltd has a market capitalization of 1,085.48 Cr, with net sales of 20.01 Cr and a net loss of 62.08 Cr over the latest four quarters. Shareholder's funds are 968.30 Cr, and total assets are valued at 1,048.13 Cr.

As of 14th August, Jindal Photo Ltd has a market capitalization of 1,085.48 Cr, categorizing it as a Micro Cap company.<BR><BR>In the latest four quarters, Jindal Photo reported net sales of 20.01 Cr. However, it experienced a loss of 62.08 Cr in net profit during the same period.<BR><BR>The latest annual reporting period for the balance sheet is March 2025. Shareholder's funds stood at 968.30 Cr, while total assets were valued at 1,048.13 Cr.

View full answer

Are Jindal Photo Ltd latest results good or bad?

01-Jun-2026

Jindal Photo Ltd's latest results are poor, showing a consolidated net loss of ₹5.66 crore for Q4 FY26, a 119.37% decline year-on-year, alongside a significant drop in net sales and a concerning interest coverage ratio of 0.23 times, indicating serious financial challenges. Investors should be cautious due to ongoing losses and revenue volatility.

Jindal Photo Ltd's latest results indicate a challenging financial situation. The company reported a consolidated net loss of ₹5.66 crore for Q4 FY26, which reflects a significant decline of 119.37% year-on-year. Additionally, net sales for the quarter were just ₹0.46 crore, down 14.81% from the previous year and showing a 28.12% decrease from the prior quarter.<BR><BR>Despite maintaining a relatively high operating margin of 67.39%, the company is struggling with severe revenue volatility and persistent losses. The interest coverage ratio has fallen to a concerning 0.23 times, indicating that operating profits are insufficient to cover interest expenses. This financial stress raises serious concerns about the company's sustainability.<BR><BR>Overall, the results can be characterized as poor, with significant operational challenges and a deteriorating financial trend. Investors should approach the situation with caution, as the erratic revenue patterns and ongoing losses suggest fundamental issues within the business model.

View full answer

When is the next results date for Jindal Photo Ltd?

27-May-2026

The next results date for Jindal Photo Ltd is 30 May 2026.

The next results date for Jindal Photo Ltd is scheduled for 30 May 2026.

View full answer

How has been the historical performance of Jindal Photo?

14-Nov-2025

Jindal Photo's historical performance has been volatile, with net sales peaking at 20.30 Cr in Mar'24 before dropping to 2.46 Cr in Mar'25, alongside significant declines in profits and total assets during the same period. The company has struggled with cash generation from core operations, maintaining zero cash flow from operating activities.

Answer:<BR>The historical performance of Jindal Photo shows significant fluctuations in key financial metrics over the years.<BR><BR>Breakdown:<BR>Jindal Photo's net sales have seen a notable increase from Mar'22 to Mar'24, rising from 0.11 Cr in Mar'22 to 20.30 Cr in Mar'24, before dropping to 2.46 Cr in Mar'25. Total operating income followed a similar trend, peaking at 20.30 Cr in Mar'24 and falling to 2.46 Cr in Mar'25. Operating profit (PBDIT) also peaked at 19.88 Cr in Mar'24 but decreased to 2.07 Cr in Mar'25. The company reported a profit before tax of 15.33 Cr in Mar'24, which turned negative to -2.89 Cr in Mar'25. Profit after tax mirrored this trend, with a high of 15.33 Cr in Mar'24 and a decline to -2.73 Cr in Mar'25. The consolidated net profit was 265.55 Cr in Mar'24, dropping to 225.94 Cr in Mar'25. On the balance sheet, total assets decreased from 2,334.55 Cr in Mar'24 to 1,048.13 Cr in Mar'25, while total liabilities also fell from 2,334.55 Cr to 1,048.13 Cr in the same period. The company's cash flow from operating activities remained at zero across the years, indicating a lack of cash generation from core operations. Overall, Jindal Photo's financial performance reflects a volatile trajectory with significant peaks and troughs in profitability and asset values.

View full answer

Is Jindal Photo technically bullish or bearish?

06-Nov-2025

As of November 4, 2025, Jindal Photo's trend is bullish, supported by strong MACD and moving averages, despite some short-term weakness indicated by the weekly RSI and a mildly bearish KST on the monthly chart.

As of 4 November 2025, the technical trend for Jindal Photo has changed from mildly bullish to bullish. The current stance is bullish with strong indicators supporting this view. Both the weekly and monthly MACD are bullish, and Bollinger Bands confirm a bullish trend in both time frames as well. The daily moving averages also indicate a bullish sentiment. However, the weekly RSI is bearish, which suggests some short-term weakness, while the KST shows a mildly bearish signal on the monthly chart. Overall, the Dow Theory supports a bullish outlook on both weekly and monthly bases. Despite some mixed signals, the prevailing trend is bullish, driven primarily by the MACD and moving averages.

View full answer

Who are the top shareholders of the Jindal Photo?

17-Jul-2025

The top shareholders of Jindal Photo are Concatenate Power Advest Private Limited with 73.18%, followed by public shareholder Manju Bhalotia Manju at 4.73%. Individual investors own 21.23%, while mutual funds and a foreign institutional investor hold negligible stakes.

The top shareholders of Jindal Photo include Concatenate Power Advest Private Limited, which holds the largest stake at 73.18%. The highest public shareholder is Manju Bhalotia Manju, with a holding of 4.73%. Additionally, individual investors collectively own 21.23% of the company. There are also two mutual fund schemes that hold a very small percentage (0.01%) and one foreign institutional investor (FII) with a negligible holding (0.0%).

View full answer

Is Jindal Photo overvalued or undervalued?

09-Jun-2025

As of May 24, 2023, Jindal Photo is considered very expensive and overvalued with a PE ratio of 3.89 and an EV to EBITDA ratio of 455.11, significantly higher than its peers, while also underperforming the Sensex with a YTD return of -5.54%.

As of 24 May 2023, Jindal Photo's valuation grade has moved from does not qualify to very expensive, indicating a significant shift in its perceived value. The company is currently considered overvalued, with a PE ratio of 3.89, an EV to EBITDA ratio of 455.11, and a ROE of 23.33%. These figures suggest that despite a relatively low PE ratio, the high EV multiples indicate a premium valuation compared to its earnings and cash flows.<BR><BR>In comparison to its peers, Jindal Photo's valuation stands out as particularly high; for instance, Altius Telecom has a PE ratio of 52.97, while Embassy Office REIT shows an EV to EBITDA of 21.67, both of which are significantly lower than Jindal Photo's metrics. Additionally, the company's recent stock performance has lagged behind the Sensex, with a YTD return of -5.54% compared to the Sensex's 5.66%, further reinforcing the notion of overvaluation in the current market context.

View full answer

Has Jindal Photo declared dividend?

06-Jun-2025

Jindal Photo Ltd has declared a 10% dividend, amounting to ₹1.00 per share, with an ex-date of September 21, 2012. Despite the dividend declaration, the dividend yield is 0%, as it has not contributed to returns in recent periods, although the stock has shown significant price appreciation over time.

Jindal Photo Ltd has declared a 10% dividend.<BR><BR>Dividend Details:<BR>- Percentage announced: 10%<BR>- Amount per share: 1.0000<BR>- Ex-date: Sep-21-2012<BR><BR>Dividend Yield: 0%<BR><BR>Total Returns by Period:<BR>In the 6-month period, the price return was -0.97%, the dividend return was 0%, resulting in a total return of -0.97%.<BR><BR>For the 1-year period, the price return was 24.14%, the dividend return was 0%, leading to a total return of 24.14%.<BR><BR>Over the 2-year period, the price return was 127.45%, the dividend return was 0%, which resulted in a total return of 127.45%.<BR><BR>In the 3-year period, the price return was 299.14%, the dividend return was 0%, culminating in a total return of 299.14%.<BR><BR>During the 4-year period, the price return was 1259.29%, the dividend return was 0%, yielding a total return of 1259.29%.<BR><BR>For the 5-year period, the price return was 5833.4%, the dividend return was 0%, resulting in a total return of 5833.4%.<BR><BR>Overall, Jindal Photo Ltd has declared a dividend, but the dividend yield remains at 0%, indicating that while dividends have been issued, they have not contributed to returns in recent periods. The total returns over various periods show significant price appreciation, particularly over the longer term.

View full answer
iScoreScore
Click here to find our call on this stock
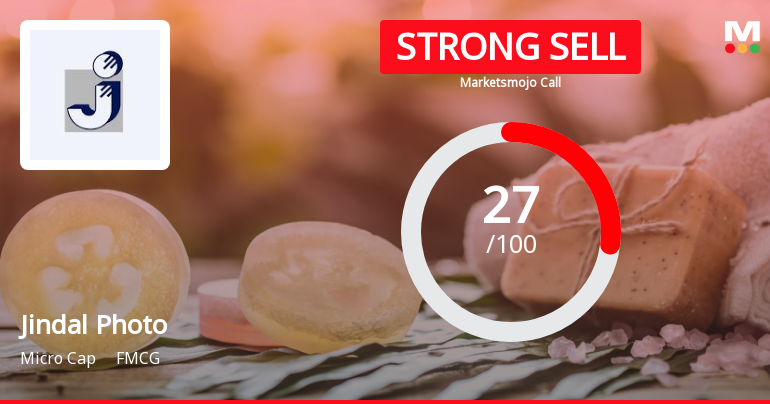
Strong Sell
Sell
Hold
Buy
Strong Buy

Dashboard

1

With ROE of -2.2, it has a Very Expensive valuation with a 1.1 Price to Book Value

  • The stock is trading at a premium compared to its peers' average historical valuations
  • Over the past year, while the stock has generated a return of 23.44%, its profits have fallen by -126.9%
2

Despite the size of the company, domestic mutual funds hold only 0.03% of the company

stock-summaryMojo Parameters

Mojo Parameters

Loading Valuation Snapshot...

Stock DNA

stock-summary
Industry

FMCG

stock-summary
Market cap

INR 1,078 Cr (Micro Cap)

stock-summary
P/E

NA (Loss Making)

stock-summary
Industry P/E

31

stock-summary
Dividend Yield

0.00%

stock-summary
Debt Equity

0.06

stock-summary
Return on Equity

-2.23%

stock-summary
Price to Book

1.05

Revenue and Profits:
Net Sales:
8 Cr
(Quarterly Results - Jun 2026)
Net Profit:
13 Cr
stock-summaryTotal Returns
Total Returns (Price + Dividend) stock-summary
Dividend Yield (0%)
TimePeriod
Price Return
Dividend Return
Total Return
3 Months
4.38%
0%
4.38%
6 Months
-20.69%
0%
-20.69%
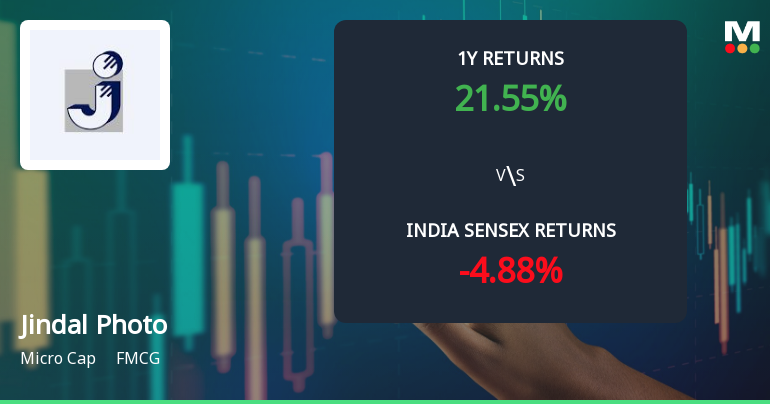
1 Year
23.56%
0%
23.56%
2 Years
19.55%
0%
19.55%
3 Years
193.03%
0%
193.03%
4 Years
240.82%
0%
240.82%
5 Years
1194.46%
0%
1194.46%

Latest dividend: 1.0000 per share ex-dividend date: Sep-21-2012

Risk Adjusted Returns v/s stock-summary
Returns Beta
Icon
Beta has not been calculated since enough price history is not available
stock-summaryNews & Corporate Actions

Announcements stock-summary

Jindal Photo Limited - Other General Purpose

09-Dec-2019 | Source : NSE

Jindal Photo Limited has informed the Exchange regarding Disclosure of Related Party Transaction under Regulation 23(9) of the SEBI (Listing Obligations and Disclosure Requirements) Regulations, 2015.

Jindal Photo Limited - Updates

29-Oct-2019 | Source : NSE

Jindal Photo Limited has informed the Exchange regarding 'CERTIFICATE UNDER REG 74(5) SEBI(DP)2018'.

Press Release

06-Sep-2019 | Source : NSE

Jindal Photo Limited has informed the Exchange regarding a press release dated September 05, 2019, titled "PUBLIC NOTICE OF AGM".

Corporate Actions stock-summary

stock-summary
BOARD MEETING

No Upcoming Board Meetings

stock-summary
DIVIDEND

Jindal Photo Ltd has declared 10% dividend, ex-date: 21 Sep 12

stock-summary
SPLITS

No Splits history available

stock-summary
BONUS

No Bonus history available

stock-summary
RIGHTS

No Rights history available

stock-summaryKey Factors

Quality key factors stock-summary

Factor
Value
Sales Growth (5y)
83.47%
EBIT Growth (5y)
83.15%
EBIT to Interest (avg)
1.91
Debt to EBITDA (avg)
Negative Net Debt
Net Debt to Equity (avg)
0.06
Sales to Capital Employed (avg)
0.01
Tax Ratio
4.85%
Dividend Payout Ratio
0
Pledged Shares
0
Institutional Holding
0.02%
ROCE (avg)
0.48%
ROE (avg)
15.64%

Valuation key factors

Factor
Value
P/E Ratio
NA (Loss Making)
Industry P/E
0
Price to Book Value
1.05
EV to EBIT
58.98
EV to EBITDA
58.83
EV to Capital Employed
1.05
EV to Sales
57.07
PEG Ratio
NA
Dividend Yield
NA
ROCE (Latest)
1.10%
ROE (Latest)
-2.23%

Technicals key factors

Indicator
Weekly
Monthly
MACD
Bearish
Mildly Bearish
RSI
No Signal
No Signal
Bollinger Bands
Mildly Bearish
Sideways
Moving Averages
Bearish (Daily)
KST
Mildly Bullish
Mildly Bearish
Dow Theory
Mildly Bearish
Mildly Bullish
OBV
Mildly Bearish
No Trend
stock-summary Technical Indicator Scale: Bearish, Mildly Bearish, Sideways, Mildly Bullish, Bullish  Turned 
stock-summaryShareholding
Shareholding Snapshot : Jun 2026stock-summary
Shareholding Compare (%holding) stock-summary
Majority shareholders

Promoters

Pledged Promoter Holdings

None

Mutual Funds

Held by 2 Schemes (0.01%)

FIIs

Held by 0 FIIs

Promoter with highest holding

Concatenate Power Advest Private Limited (73.18%)

Highest Public shareholder

Manju Bhalotia Manju (4.44%)

Individual Investors Holdings

17.37%

stock-summaryFinancial
[
  {
    "link": "quarterly",
    "btn_text": "All Quarterly Results",
    "header": "Quarterly Results Snapshot (Consolidated) - Jun'26 - QoQ",
    "rhs": [
      {
        "prefix": "Net Sales ",
        "suffix": "QoQ Growth in quarter ended Jun 2026 is 1,632.61% vs -28.12% in Mar 2026",
        "dir": 1
      },
      {
        "prefix": "Consolidated Net Profit ",
        "suffix": "QoQ Growth in quarter ended Jun 2026 is 331.10% vs 95.16% in Mar 2026",
        "dir": 1
      }
    ],
    "table": {
      "header": [
        "Jun'26",
        "Mar'26",
        "Change(%)"
      ],
      "body": [
        {
          "field": "Net Sales",
          "val1": "7.97",
          "val2": "0.46",
          "chgp": "1,632.61%",
          "chgp_class": "positive"
        },
        {
          "field": "Operating Profit (PBDIT) excl Other Income",
          "val1": "7.82",
          "val2": "0.31",
          "chgp": "2,422.58%",
          "chgp_class": "positive"
        },
        {
          "field": "Interest",
          "val1": "1.04",
          "val2": "1.34",
          "chgp": "-22.39%",
          "chgp_class": "positive"
        },
        {
          "field": "Exceptional Items",
          "val1": "0.00",
          "val2": "0.00",
          "chgp": "",
          "chgp_class": "neutral"
        },
        {
          "field": "Consolidate Net Profit",
          "val1": "13.08",
          "val2": "-5.66",
          "chgp": "331.10%",
          "chgp_class": "positive"
        },
        {
          "field": "Operating Profit Margin (Excl OI)",
          "val1": "98.12%",
          "val2": "67.39%",
          "chgp": "30.73%",
          "chgp_class": "positive"
        }
      ]
    }
  },
  {
    "link": "half-yearly",
    "btn_text": "All Half Yearly Results",
    "header": "Half Yearly Results Snapshot (Consolidated) - Sep'25",
    "rhs": [
      {
        "prefix": "Net Sales ",
        "suffix": " Growth in half year ended Sep 2025 is 697.22% vs 60.00% in Sep 2024",
        "dir": 1
      },
      {
        "prefix": "Consolidated Net Profit ",
        "suffix": " Growth in half year ended Sep 2025 is -42.00% vs 116.90% in Sep 2024",
        "dir": -1
      }
    ],
    "table": {
      "header": [
        "Sep'25",
        "Sep'24",
        "Change(%)"
      ],
      "body": [
        {
          "field": "Net Sales",
          "val1": "11.48",
          "val2": "1.44",
          "chgp": "697.22%",
          "chgp_class": "positive"
        },
        {
          "field": "Operating Profit (PBDIT) excl Other Income",
          "val1": "11.26",
          "val2": "1.26",
          "chgp": "793.65%",
          "chgp_class": "positive"
        },
        {
          "field": "Interest",
          "val1": "2.67",
          "val2": "2.45",
          "chgp": "8.98%",
          "chgp_class": "negative"
        },
        {
          "field": "Exceptional Items",
          "val1": "0.00",
          "val2": "0.00",
          "chgp": "",
          "chgp_class": "neutral"
        },
        {
          "field": "Consolidate Net Profit",
          "val1": "99.82",
          "val2": "172.11",
          "chgp": "-42.00%",
          "chgp_class": "negative"
        },
        {
          "field": "Operating Profit Margin (Excl OI)",
          "val1": "98.08%",
          "val2": "87.50%",
          "chgp": "10.58%",
          "chgp_class": "positive"
        }
      ]
    }
  },
  {
    "link": "nine-monthly",
    "btn_text": "All Nine Monthly Results",
    "header": "Nine Monthly Results Snapshot (Consolidated) - Dec'25",
    "rhs": [
      {
        "prefix": "Net Sales ",
        "suffix": "YoY Growth in nine months ended Dec 2025 is 531.25% vs 44.36% in Dec 2024",
        "dir": 1
      },
      {
        "prefix": "Consolidated Net Profit ",
        "suffix": "YoY Growth in nine months ended Dec 2025 is -108.70% vs 16.13% in Dec 2024",
        "dir": -1
      }
    ],
    "table": {
      "header": [
        "Dec'25",
        "Dec'24",
        "Change(%)"
      ],
      "body": [
        {
          "field": "Net Sales",
          "val1": "12.12",
          "val2": "1.92",
          "chgp": "531.25%",
          "chgp_class": "positive"
        },
        {
          "field": "Operating Profit (PBDIT) excl Other Income",
          "val1": "11.73",
          "val2": "1.61",
          "chgp": "628.57%",
          "chgp_class": "positive"
        },
        {
          "field": "Interest",
          "val1": "4.01",
          "val2": "3.68",
          "chgp": "8.97%",
          "chgp_class": "negative"
        },
        {
          "field": "Exceptional Items",
          "val1": "0.00",
          "val2": "0.00",
          "chgp": "",
          "chgp_class": "neutral"
        },
        {
          "field": "Consolidate Net Profit",
          "val1": "-17.12",
          "val2": "196.72",
          "chgp": "-108.70%",
          "chgp_class": "negative"
        },
        {
          "field": "Operating Profit Margin (Excl OI)",
          "val1": "96.78%",
          "val2": "83.85%",
          "chgp": "12.93%",
          "chgp_class": "positive"
        }
      ]
    }
  },
  {
    "link": "annual",
    "btn_text": "All Annual Results",
    "header": "Annual Results Snapshot (Consolidated) - Mar'26",
    "rhs": [
      {
        "prefix": "Net Sales ",
        "suffix": "YoY Growth in year ended Mar 2026 is 411.38% vs -87.88% in Mar 2025",
        "dir": 1
      },
      {
        "prefix": "Consolidated Net Profit ",
        "suffix": "YoY Growth in year ended Mar 2026 is -110.09% vs -14.92% in Mar 2025",
        "dir": -1
      }
    ],
    "table": {
      "header": [
        "Mar'26",
        "Mar'25",
        "Change(%)"
      ],
      "body": [
        {
          "field": "Net Sales",
          "val1": "12.58",
          "val2": "2.46",
          "chgp": "411.38%",
          "chgp_class": "positive"
        },
        {
          "field": "Operating Profit (PBDIT) excl Other Income",
          "val1": "12.04",
          "val2": "2.06",
          "chgp": "484.47%",
          "chgp_class": "positive"
        },
        {
          "field": "Interest",
          "val1": "5.35",
          "val2": "4.91",
          "chgp": "8.96%",
          "chgp_class": "negative"
        },
        {
          "field": "Exceptional Items",
          "val1": "0.00",
          "val2": "0.00",
          "chgp": "",
          "chgp_class": "neutral"
        },
        {
          "field": "Consolidate Net Profit",
          "val1": "-22.79",
          "val2": "225.94",
          "chgp": "-110.09%",
          "chgp_class": "negative"
        },
        {
          "field": "Operating Profit Margin (Excl OI)",
          "val1": "95.71%",
          "val2": "84.08%",
          "chgp": "11.63%",
          "chgp_class": "positive"
        }
      ]
    }
  }
]

Quarterly Results Snapshot (Consolidated) - Jun'26 - QoQstock-summary

Jun'26
Mar'26
Change(%)
Net Sales
7.97
0.46
1,632.61%
Operating Profit (PBDIT) excl Other Income
7.82
0.31
2,422.58%
Interest
1.04
1.34
-22.39%
Exceptional Items
0.00
0.00
Consolidate Net Profit
13.08
-5.66
331.10%
Operating Profit Margin (Excl OI)
98.12%
67.39%
30.73%
Values in Rs Cr.
Direction Arrows
Net Sales

QoQ Growth in quarter ended Jun 2026 is 1,632.61% vs -28.12% in Mar 2026

Direction Arrows
Consolidated Net Profit

QoQ Growth in quarter ended Jun 2026 is 331.10% vs 95.16% in Mar 2026

Half Yearly Results Snapshot (Consolidated) - Sep'25stock-summary

Sep'25
Sep'24
Change(%)
Net Sales
11.48
1.44
697.22%
Operating Profit (PBDIT) excl Other Income
11.26
1.26
793.65%
Interest
2.67
2.45
8.98%
Exceptional Items
0.00
0.00
Consolidate Net Profit
99.82
172.11
-42.00%
Operating Profit Margin (Excl OI)
98.08%
87.50%
10.58%
Values in Rs Cr.
Direction Arrows
Net Sales

Growth in half year ended Sep 2025 is 697.22% vs 60.00% in Sep 2024

Direction Arrows
Consolidated Net Profit

Growth in half year ended Sep 2025 is -42.00% vs 116.90% in Sep 2024

Nine Monthly Results Snapshot (Consolidated) - Dec'25stock-summary

Dec'25
Dec'24
Change(%)
Net Sales
12.12
1.92
531.25%
Operating Profit (PBDIT) excl Other Income
11.73
1.61
628.57%
Interest
4.01
3.68
8.97%
Exceptional Items
0.00
0.00
Consolidate Net Profit
-17.12
196.72
-108.70%
Operating Profit Margin (Excl OI)
96.78%
83.85%
12.93%
Values in Rs Cr.
Direction Arrows
Net Sales

YoY Growth in nine months ended Dec 2025 is 531.25% vs 44.36% in Dec 2024

Direction Arrows
Consolidated Net Profit

YoY Growth in nine months ended Dec 2025 is -108.70% vs 16.13% in Dec 2024

Annual Results Snapshot (Consolidated) - Mar'26stock-summary

Mar'26
Mar'25
Change(%)
Net Sales
12.58
2.46
411.38%
Operating Profit (PBDIT) excl Other Income
12.04
2.06
484.47%
Interest
5.35
4.91
8.96%
Exceptional Items
0.00
0.00
Consolidate Net Profit
-22.79
225.94
-110.09%
Operating Profit Margin (Excl OI)
95.71%
84.08%
11.63%
Values in Rs Cr.
Direction Arrows
Net Sales

YoY Growth in year ended Mar 2026 is 411.38% vs -87.88% in Mar 2025

Direction Arrows
Consolidated Net Profit

YoY Growth in year ended Mar 2026 is -110.09% vs -14.92% in Mar 2025

stock-summaryCompany CV
About Jindal Photo Ltd stock-summary
stock-summary
Jindal Photo Ltd
Micro Cap
FMCG
Jindal Photo Ltd is India's one of the largest manufacturer of photographic and allied products. The company is engaged in the manufacture of photographic paper and films. The product range includes Color Roll Films, Cameras, Photographic Color Paper, Medical X-Ray Films & Equipments, Cine Color Positive Film, Photo Processing Equipments and Photographic Chemicals etc.
Company Coordinates stock-summary
Company Details
19th KM Hapur-Bulandshahr Road, P O Gulaothi Bulandshahr Uttar Pradesh : 203408
stock-summary
Tel:
stock-summary
cs_jphoto@jindalgroup.com
Registrar Details