
Compare Onelife Capital with Similar Stocks
Dashboard
With a Operating Losses, the company has a Weak Long Term Fundamental Strength
- Poor long term growth as Net Sales has grown by an annual rate of 2.94% and Operating profit at 9.44%
Negative results in Dec 25
With ROE of -15.9, it has a Very Expensive valuation with a 2.2 Price to Book Value
99.21% of Promoter Shares are Pledged
Stock DNA
Capital Markets
INR 57 Cr (Micro Cap)
NA (Loss Making)
19
0.00%
1.29
-15.86%
2.31
Total Returns (Price + Dividend) 
Onelife Capital for the last several years.
Risk Adjusted Returns v/s
Returns Beta

News
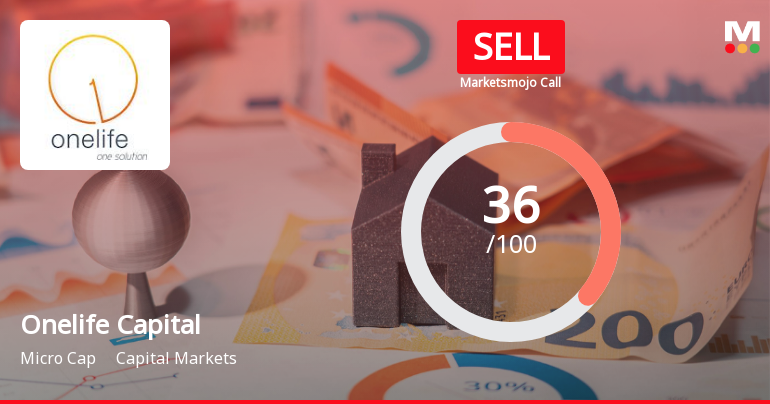
Onelife Capital Advisors Ltd Upgraded to Sell Amid Mixed Financial and Valuation Signals
Onelife Capital Advisors Ltd has seen its investment rating upgraded from Strong Sell to Sell as of 1 April 2026, reflecting a nuanced shift in its market standing. Despite ongoing financial headwinds, the company’s stock has delivered robust returns, prompting a reassessment across key parameters including quality, valuation, financial trend, and technicals.
Read full news article
Onelife Capital Advisors Ltd is Rated Strong Sell
Onelife Capital Advisors Ltd is rated Strong Sell by MarketsMOJO. This rating was last updated on 17 March 2026. However, the analysis and financial metrics discussed here reflect the stock's current position as of 31 March 2026, providing investors with the most up-to-date view of the company’s fundamentals, valuation, financial trends, and technical outlook.
Read full news article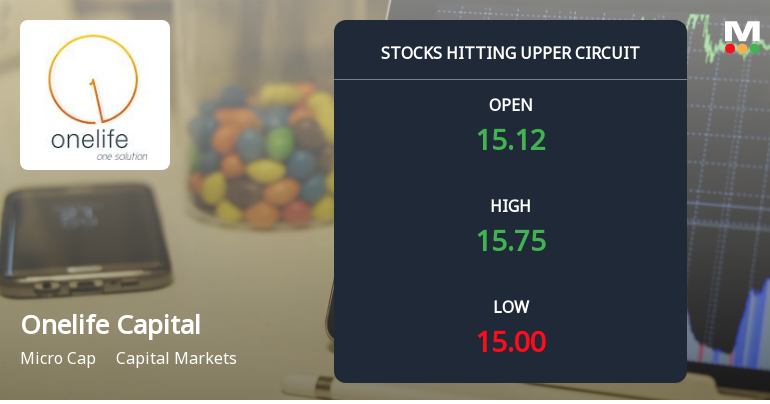
Onelife Capital Advisors Ltd Locks at Upper Circuit With 2.33% Gain — Buyers Queue, Sellers Absent
At Rs 15.75, the buying was done — not because demand dried up, but because the exchange wouldn't let the stock go any higher. Onelife Capital Advisors Ltd locked at its upper circuit of 2.33% on 27 Mar 2026, with buyers queuing and no sellers willing to part with shares.
Read full news article Announcements
Onelife Capital Advisors Limited - Outcome of Board Meeting
18-Nov-2019 | Source : NSEOnelife Capital Advisors Limited has informed the Exchange regarding Board meeting held on November 13, 2019.
Onelife Capital Advisors Limited - Updates
16-Oct-2019 | Source : NSEOnelife Capital Advisors Limited has informed the Exchange regarding 'Confirmation Certificate under Regulation 74 (5) of SEBI (Depositories and Participant) Regulations, 2018 '.
Onelife Capital Advisors Limited - Extension of Annual General Meeting
25-Sep-2019 | Source : NSEOnelife Capital Advisors Limited has informed the Exchange regarding Intimation of Extension of Time for holding Annual General Meeting
Corporate Actions

No Upcoming Board Meetings

No Dividend history available

No Splits history available

No Bonus history available

Onelife Capital Advisors Ltd has announced 300:167 rights issue, ex-date: 16 Feb 26
Quality key factors
Valuation key factors
Technicals key factors
 Technical Indicator Scale: Bearish, Mildly Bearish, Sideways, Mildly Bullish, Bullish Turned
 Shareholding Snapshot : Dec 2025
Shareholding Compare (%holding)
Promoters
99.2098
Held by 0 Schemes
Held by 0 FIIs
Naig Prabhakar K (51.68%)
P S Kumaresan (1.57%)
43.49%
Quarterly Results Snapshot (Consolidated) - Dec'25 - QoQ

QoQ Growth in quarter ended Dec 2025 is -86.79% vs 354.12% in Sep 2025

QoQ Growth in quarter ended Dec 2025 is 62.39% vs -786.27% in Sep 2025
Half Yearly Results Snapshot (Consolidated) - Sep'25
Growth in half year ended Sep 2025 is -45.99% vs 179.49% in Sep 2024
Growth in half year ended Sep 2025 is 18.34% vs -833.33% in Sep 2024
Nine Monthly Results Snapshot (Consolidated) - Dec'25
YoY Growth in nine months ended Dec 2025 is -48.06% vs 118.95% in Dec 2024
YoY Growth in nine months ended Dec 2025 is 24.21% vs -665.52% in Dec 2024
Annual Results Snapshot (Consolidated) - Mar'25
YoY Growth in year ended Mar 2025 is -69.51% vs 733.33% in Mar 2024
YoY Growth in year ended Mar 2025 is -1,417.95% vs 115.73% in Mar 2024
About Onelife Capital Advisors Ltd

Company Coordinates


