
Compare MPS with Similar Stocks
Stock DNA
Other Consumer Services
INR 3,088 Cr (Small Cap)
19.00
13
2.75%
-0.10
28.32%
5.21
Total Returns (Price + Dividend) 
Latest dividend: 50 per share ex-dividend date: Aug-13-2025
Risk Adjusted Returns v/s
Returns Beta

News

MPS Ltd. Valuation Shifts to Very Expensive Amid Mixed Market Returns
MPS Ltd., a small-cap player in the Other Consumer Services sector, has seen a marked shift in its valuation parameters, moving from expensive to very expensive territory. This change, coupled with a recent downgrade in its Mojo Grade from Hold to Sell, raises questions about the stock’s price attractiveness relative to its historical averages and peer group benchmarks.
Read full news article
MPS Ltd. is Rated Sell by MarketsMOJO
MPS Ltd. is rated 'Sell' by MarketsMOJO, with this rating last updated on 13 Aug 2025. However, the analysis and financial metrics discussed here reflect the stock's current position as of 23 May 2026, providing investors with an up-to-date view of the company’s fundamentals, valuation, financial trends, and technical outlook.
Read full news article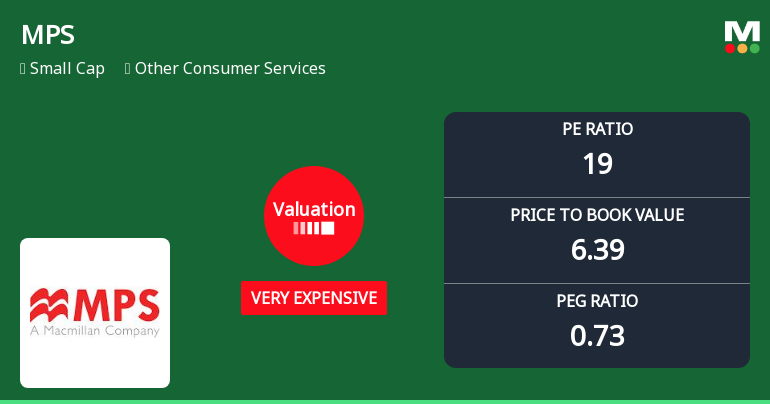
MPS Ltd. Valuation Shifts Signal Heightened Price Risk Amid Strong Fundamentals
MPS Ltd., a small-cap player in the Other Consumer Services sector, has seen a marked shift in its valuation parameters, moving from expensive to very expensive territory. This transition, coupled with a recent downgrade in its Mojo Grade from Hold to Sell, raises important questions about the stock’s price attractiveness amid evolving market dynamics and peer comparisons.
Read full news article Announcements
MPS Limited - Other General Purpose
28-Nov-2019 | Source : NSEMPS Limited has informed the Exchange regarding Disclosure of Related Party Transactions for the half year ended on September 30, 2019
MPS Limited - Updates
01-Nov-2019 | Source : NSEMPS Limited has informed the Exchange regarding 'Copies of the newspaper advertisements as per Regulation 47 (3) of SEBI (Listing Obligations and Disclosure Requirements), 2015'.
MPS Limited - Dividend
31-Oct-2019 | Source : NSEMPS Limited has informed the Exchange that Board of Directors at its meeting held on October 30, 2019, declared Special Dividend of 50 per equity share.
Corporate Actions

No Upcoming Board Meetings

MPS Ltd. has declared 500% dividend, ex-date: 13 Aug 25

No Splits history available

No Bonus history available

No Rights history available
Quality key factors
Valuation key factors
Technicals key factors
 Technical Indicator Scale: Bearish, Mildly Bearish, Sideways, Mildly Bullish, Bullish Turned
 Shareholding Snapshot : Mar 2026
Shareholding Compare (%holding)
Promoters
None
Held by 2 Schemes (0.1%)
Held by 47 FIIs (1.47%)
Adi Bpo Services Limited (68.34%)
Mukul Mahavir Agrawal (4.46%)
22.35%
Quarterly Results Snapshot (Consolidated) - Mar'26 - YoY

YoY Growth in quarter ended Mar 2026 is 12.66% vs 21.88% in Mar 2025
YoY Growth in quarter ended Mar 2026 is -0.06% vs 63.95% in Mar 2025
Half Yearly Results Snapshot (Consolidated) - Sep'25
Growth in half year ended Sep 2025 is 6.22% vs 36.76% in Sep 2024

Growth in half year ended Sep 2025 is 48.34% vs 1.33% in Sep 2024
Nine Monthly Results Snapshot (Consolidated) - Dec'25
YoY Growth in nine months ended Dec 2025 is 3.38% vs 37.61% in Dec 2024
YoY Growth in nine months ended Dec 2025 is 23.90% vs 13.08% in Dec 2024
Annual Results Snapshot (Consolidated) - Mar'26
YoY Growth in year ended Mar 2026 is 5.71% vs 33.30% in Mar 2025
YoY Growth in year ended Mar 2026 is 16.33% vs 25.38% in Mar 2025
About MPS Ltd.

Company Coordinates


