
Compare PTC Industries with Similar Stocks
Dashboard
Company has a Debt to Equity ratio (avg) of 0.35 times
Healthy long term growth as Net Sales has grown by an annual rate of 29.84% and Operating profit at 35.89%
With a growth in Net Profit of 226.49%, the company declared Outstanding results in Mar 26
Increasing Participation by Institutional Investors
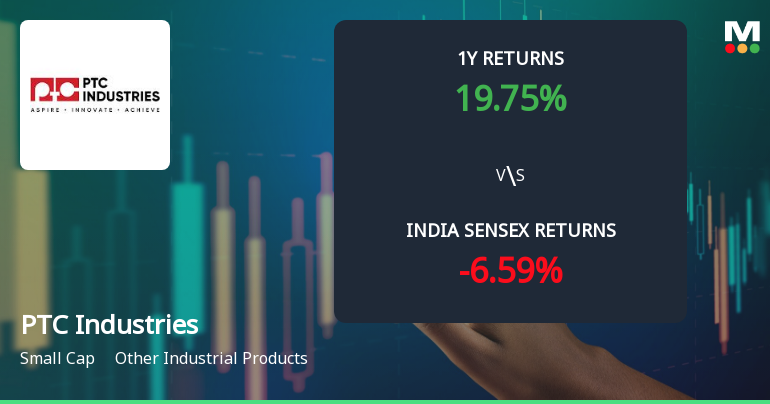
Market Beating performance in long term as well as near term
With its market cap of Rs 26,283 cr, it is the biggest company in the sector and constitutes 34.01% of the entire sector
Stock DNA
Other Industrial Products
INR 26,158 Cr (Small Cap)
259.00
31
0.00%
0.08
6.74%
17.44
Total Returns (Price + Dividend) 
PTC Industries for the last several years.
Risk Adjusted Returns v/s
Returns Beta

News
PTC Industries Ltd Technical Momentum Shifts Signal Mildly Bullish Outlook
PTC Industries Ltd, a small-cap player in the Other Industrial Products sector, has experienced a nuanced shift in its technical momentum, moving from a bullish to a mildly bullish stance. Recent technical indicators, including MACD, RSI, moving averages, and Bollinger Bands, reveal a complex but cautiously optimistic picture for investors as the stock navigates near-term volatility and longer-term growth potential.
Read full news article
MarketsMOJO Upgrades PTC Industries Ltd to Buy on Strong Financial and Technical Performance
PTC Industries Ltd has been upgraded from a Hold to a Buy rating following a comprehensive reassessment of its quality, valuation, financial trends, and technical indicators. The company’s robust quarterly results, improving technical momentum, and sustained long-term growth have collectively driven this positive revision in outlook.
Read full news article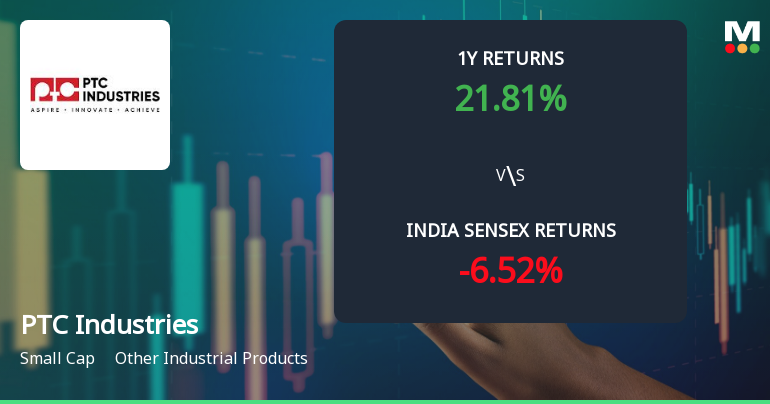
PTC Industries Ltd Technical Momentum Shifts Signal Bullish Outlook
PTC Industries Ltd has exhibited a notable shift in its technical momentum, upgrading from a mildly bullish to a bullish stance, supported by a confluence of positive signals across key indicators such as MACD, Bollinger Bands, and moving averages. This technical evolution, coupled with strong long-term returns and a recent upgrade in its Mojo Grade to Buy, positions the small-cap industrial stock as an attractive proposition for investors seeking growth in the Other Industrial Products sector.
Read full news article Announcements
Corporate Actions

No Upcoming Board Meetings

No Dividend history available

No Splits history available

No Bonus history available

PTC Industries Ltd has announced 3:2 rights issue, ex-date: 21 Jul 22
Quality key factors
Valuation key factors
Technicals key factors
 Technical Indicator Scale: Bearish, Mildly Bearish, Sideways, Mildly Bullish, Bullish Turned
 Shareholding Snapshot : Mar 2026
Shareholding Compare (%holding)
Promoters
None
Held by 22 Schemes (6.76%)
Held by 76 FIIs (3.96%)
Sachin Agarwal (19.05%)
Motilal Oswal Large And Midcap Fund (3.72%)
22.93%
Quarterly Results Snapshot (Consolidated) - Mar'26 - QoQ

QoQ Growth in quarter ended Mar 2026 is 44.97% vs 24.79% in Dec 2025
QoQ Growth in quarter ended Mar 2026 is 226.49% vs 1.16% in Dec 2025
Half Yearly Results Snapshot (Consolidated) - Sep'25
Growth in half year ended Sep 2025 is 86.00% vs -7.59% in Sep 2024

Growth in half year ended Sep 2025 is 4.91% vs 14.32% in Sep 2024
Nine Monthly Results Snapshot (Consolidated) - Dec'25
YoY Growth in nine months ended Dec 2025 is 102.69% vs 0.91% in Dec 2024
YoY Growth in nine months ended Dec 2025 is 14.27% vs 32.51% in Dec 2024
Annual Results Snapshot (Consolidated) - Mar'26
YoY Growth in year ended Mar 2026 is 95.66% vs 19.93% in Mar 2025
YoY Growth in year ended Mar 2026 is 66.44% vs 44.53% in Mar 2025
About PTC Industries Ltd

Company Coordinates


