
Compare Kothari Sugars with Similar Stocks
Dashboard
With a Operating Losses, the company has a Weak Long Term Fundamental Strength
- The company has been able to generate a Return on Equity (avg) of 8.52% signifying low profitability per unit of shareholders funds
The company has declared Negative results for the last 9 consecutive quarters
Risky - Negative EBITDA
Below par performance in long term as well as near term
Stock DNA
Sugar
INR 216 Cr (Micro Cap)
NA (Loss Making)
19
0.00%
-0.12
-4.77%
0.72
Total Returns (Price + Dividend) 
Latest dividend: 0.5 per share ex-dividend date: Feb-20-2024
Risk Adjusted Returns v/s
Returns Beta

News
Kothari Sugars & Chemicals Ltd is Rated Strong Sell
Kothari Sugars & Chemicals Ltd is rated Strong Sell by MarketsMOJO. This rating was last updated on 05 May 2026. However, the analysis and financial metrics discussed here reflect the stock’s current position as of 23 June 2026, providing investors with the latest insights into the company’s performance and outlook.
Read full news article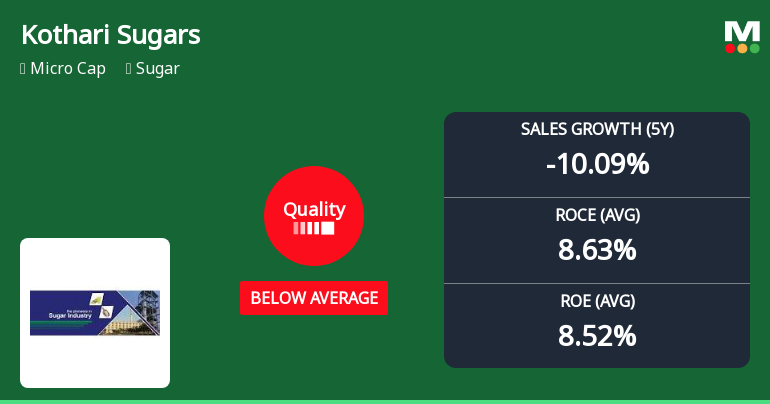
Kothari Sugars & Chemicals Ltd Quality Parameters Deteriorate Amid Weak Financials
Kothari Sugars & Chemicals Ltd has recently experienced a downgrade in its quality grade from average to below average, reflecting a deterioration in key business fundamentals. This article analyses the changes in the company’s financial metrics, including return on equity (ROE), return on capital employed (ROCE), debt levels, and growth consistency, placing these in the context of its industry peers and broader market performance.
Read full news article
Kothari Sugars & Chemicals Ltd is Rated Strong Sell
Kothari Sugars & Chemicals Ltd is rated Strong Sell by MarketsMOJO, with this rating last updated on 05 May 2026. However, the analysis and financial metrics discussed here reflect the stock's current position as of 12 June 2026, providing investors with an up-to-date view of the company’s fundamentals, returns, and market standing.
Read full news article Announcements
Kothari Sugars And Chemicals Limited - Outcome of Board Meeting
25-Oct-2019 | Source : NSEKothari Sugars And Chemicals Limited has informed the Exchange regarding the outcome of Board meeting held on October 25, 2019.
Credit Rating
03-Sep-2019 | Source : NSE
| Kothari Sugars And Chemicals Limited has informed the Exchange regarding Credit Rating |
Shareholders meeting
08-Aug-2019 | Source : NSE
| Kothari Sugars And Chemicals Limited has submitted the Exchange a copy Srutinizers report of Annual General Meeting held on August 07, 2019. Further, the company has informed the Exchange regarding voting results. |
Corporate Actions

No Upcoming Board Meetings

Kothari Sugars & Chemicals Ltd has declared 5% dividend, ex-date: 20 Feb 24

No Splits history available

No Bonus history available

No Rights history available
Quality key factors
Valuation key factors
Technicals key factors
 Technical Indicator Scale: Bearish, Mildly Bearish, Sideways, Mildly Bullish, Bullish Turned
 Shareholding Snapshot : Mar 2026
Shareholding Compare (%holding)
Promoters
None
Held by 4 Schemes (0.0%)
Held by 1 FIIs (0.16%)
Nbk Real Estates Private Ltd (70.2%)
None
22.9%
Quarterly Results Snapshot (Standalone) - Mar'26 - QoQ

QoQ Growth in quarter ended Mar 2026 is -40.13% vs 3.01% in Dec 2025
QoQ Growth in quarter ended Mar 2026 is -94.73% vs 265.42% in Dec 2025
Half Yearly Results Snapshot (Standalone) - Sep'25

Growth in half year ended Sep 2025 is -29.54% vs -30.76% in Sep 2024
Growth in half year ended Sep 2025 is -204.73% vs -75.26% in Sep 2024
Nine Monthly Results Snapshot (Standalone) - Dec'25
YoY Growth in nine months ended Dec 2025 is -25.24% vs -32.93% in Dec 2024
YoY Growth in nine months ended Dec 2025 is -46.17% vs -53.40% in Dec 2024
Annual Results Snapshot (Standalone) - Mar'26
YoY Growth in year ended Mar 2026 is -20.40% vs -38.33% in Mar 2025
YoY Growth in year ended Mar 2026 is -36.63% vs -64.63% in Mar 2025
About Kothari Sugars & Chemicals Ltd

Company Coordinates


