
Compare IL&FS Engg. with Similar Stocks
Dashboard
With a Negative Book Value, the company has a Weak Long Term Fundamental Strength
- Poor long term growth as Net Sales has grown by an annual rate of -10.80% and Operating profit at 0% over the last 5 years
- The company has a negative book value of Rs 3,189.88 crore
Flat results in Mar 26
Risky - Negative EBITDA
Underperformed the market in the last 1 year
Total Returns (Price + Dividend) 
Latest dividend: 1.5 per share ex-dividend date: Sep-19-2008
Risk Adjusted Returns v/s
Returns Beta

News
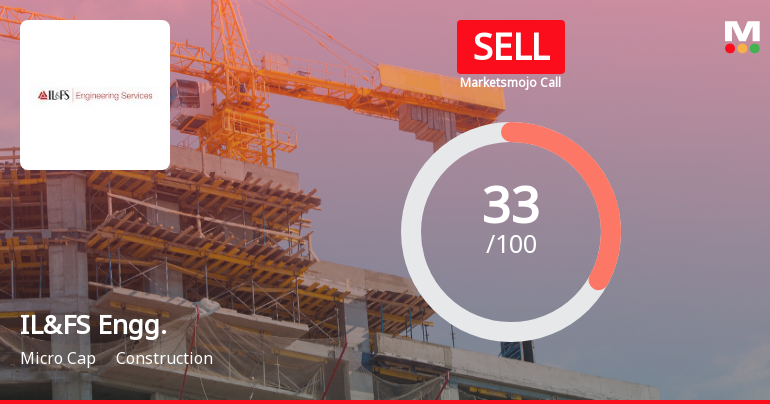
IL&FS Engineering & Construction Upgraded to Sell on Technical Improvements Despite Weak Fundamentals
IL&FS Engineering & Construction Co Ltd has seen its investment rating upgraded from Strong Sell to Sell, driven primarily by a shift in technical indicators despite persistent fundamental weaknesses. The micro-cap construction company’s technical outlook has improved to mildly bullish, prompting the revision, although its financial and valuation metrics remain challenging.
Read full news article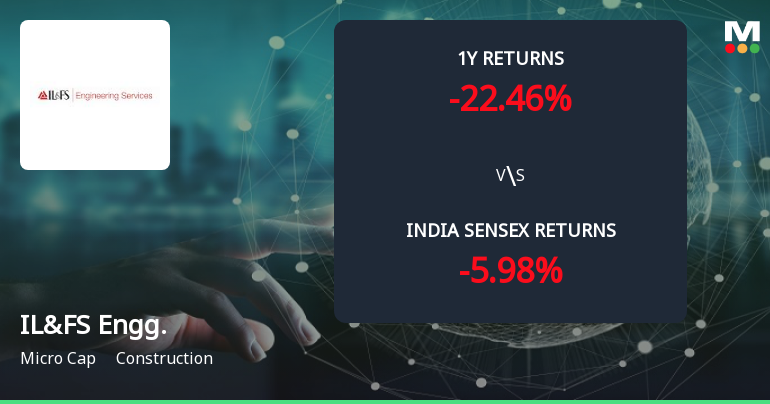
Golden Cross Forms in IL&FS Engineering & Construction Co Ltd — On a Day of Mixed Technical Signals
The 50-day moving average has crossed above the 200-day moving average for IL&FS Engineering & Construction Co Ltd, signalling a golden cross on 15 Jun 2026. Yet, the stock’s price was unchanged on the day, and monthly technical indicators remain bearish. This divergence between the moving averages and broader momentum indicators invites a deeper look into the signal’s reliability.
Read full news article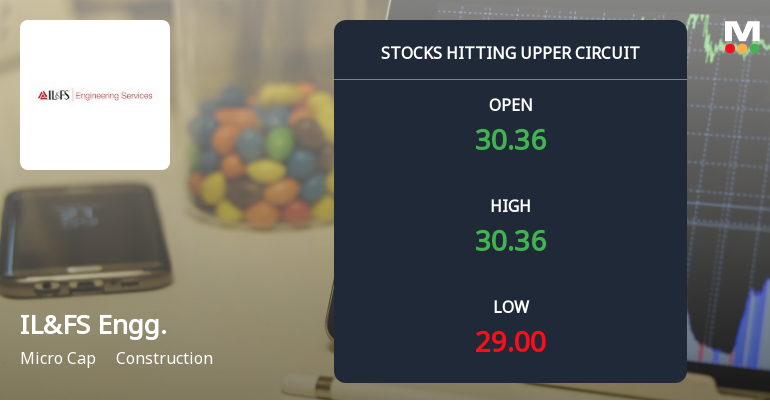
IL&FS Engineering & Construction Co Ltd Locks at Upper Circuit With 5% Gain — Buyers Queue, Sellers Absent
At Rs 30.36, the buying was done — not because demand dried up, but because the exchange wouldn't let the stock go any higher. IL&FS Engineering & Construction Co Ltd locked at its upper circuit of 5% on 15 Jun 2026, with buyers queuing and no sellers willing to part with shares.
Read full news article Announcements
IL&FS Engineering and Construction Company Limited - AGM/Book Closure
09-Dec-2019 | Source : NSEIL&FS Engineering and Construction Company Limited has informed the Exchange that the Register of Members & Share Transfer Books of the Company will remain closed from December 24, 2019 to December 30, 2019(both days inclusive) for the purpose of For the AGM of the Company scheduled to be held on December 30, 2019
IL&FS Engineering and Construction Company Limited - Shareholders meeting
26-Nov-2019 | Source : NSEIL&FS Engineering and Construction Company Limited has informed the Exchange that the revised date of Annual General Meeting is December 30, 2019
IL&FS Engineering and Construction Company Limited - Trading Window
15-Nov-2019 | Source : NSEIL&FS Engineering and Construction Company Limited has informed the Exchange regarding the Trading Window closure pursuant to SEBI (Prohibition of Insider Trading) Regulations, 2015 - extension of Closure of trading window due to postponement of Board Meeting i.e., Nov 11, 2019 to Nov 21, 2019 (both days inclusive)
Corporate Actions

No Upcoming Board Meetings

IL&FS Engineering & Construction Co Ltd has declared 15% dividend, ex-date: 19 Sep 08

No Splits history available

No Bonus history available

No Rights history available
Quality key factors
Valuation key factors
Technicals key factors
 Technical Indicator Scale: Bearish, Mildly Bearish, Sideways, Mildly Bullish, Bullish Turned
 Shareholding Snapshot : Mar 2026
Shareholding Compare (%holding)
Non Institution
None
Held by 0 Schemes
Held by 5 FIIs (0.7%)
Il&fs Financial Services Limited (21.29%)
Sbg Projects Investments Limited (27.87%)
16.1%
Quarterly Results Snapshot (Consolidated) - Mar'26 - QoQ

QoQ Growth in quarter ended Mar 2026 is -52.20% vs 14.36% in Dec 2025

QoQ Growth in quarter ended Mar 2026 is 466.85% vs 241.27% in Dec 2025
Half Yearly Results Snapshot (Consolidated) - Sep'25
Growth in half year ended Sep 2025 is -36.76% vs 19.34% in Sep 2024
Growth in half year ended Sep 2025 is 23.16% vs -204.41% in Sep 2024
Nine Monthly Results Snapshot (Consolidated) - Dec'25
YoY Growth in nine months ended Dec 2025 is -27.91% vs 26.13% in Dec 2024
YoY Growth in nine months ended Dec 2025 is 28.35% vs -158.73% in Dec 2024
Annual Results Snapshot (Consolidated) - Mar'26
YoY Growth in year ended Mar 2026 is -41.53% vs 24.31% in Mar 2025
YoY Growth in year ended Mar 2026 is 127.25% vs 93.70% in Mar 2025
About IL&FS Engineering & Construction Co Ltd

Company Coordinates


