Insecticid.India

  • Market Cap: Small Cap
  • Industry: Pesticides & Agrochemicals
  • ISIN: INE070I01018
  • NSEID: INSECTICID
  • BSEID: 532851
INR
592.00
-6.5 (-1.09%)
BSENSE

Aug 31, 09:40 AM

BSE+NSE Vol: 2.23 k

  • Price Points
  • Score
  • Mojo Parameters
  • Total Return
  • News and Corporate Actions
  • Key factors
  • Shareholding
  • Financials
  • CompanyCV
stock-summaryPrice Point
High/Low

1Day

52 Week

Valuation
Technical
Day's Volume

CASH

2.23 k (-19.24%) Volume

Shareholding (Jun 2026)

FII

4.40%

Held by 41 FIIs

DII

9.26%

Held by 9 DIIs

Promoter

72.30%

Why is Insecticides India Ltd falling/rising?

31-Aug-2026

As of 30-Aug, Insecticides India Ltd's stock price is rising to Rs 597.75, up 5.67%, driven by strong buying interest and increased investor participation. Despite recent gains, the stock has a -26.04% return over the past year and has shown poor long-term growth.

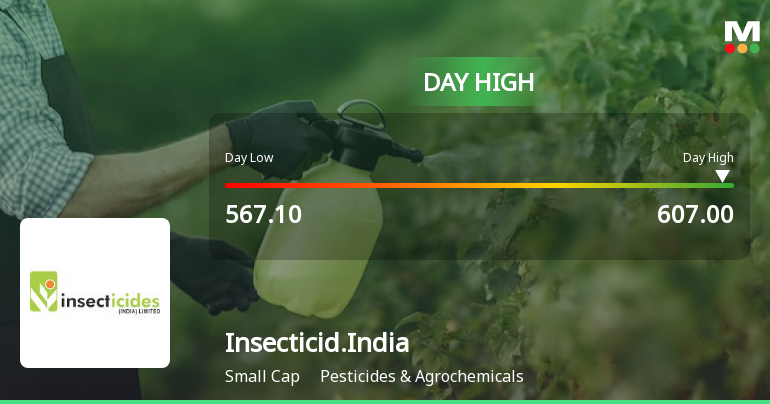
As of 30-Aug, Insecticides India Ltd's stock price is rising, currently at Rs 597.75, reflecting an increase of Rs 32.05 or 5.67%. This rise can be attributed to several factors. Firstly, the stock has outperformed its sector by 6.06% today, indicating positive market sentiment. Additionally, the stock reached an intraday high of Rs 607.2, which is a 7.34% increase, suggesting strong buying interest.<BR><BR>Investor participation has also increased, with a delivery volume of 42.94k on 27 August, which is up by 39.22% compared to the 5-day average. This indicates that more investors are willing to hold the stock, contributing to the upward price movement. Furthermore, the stock is trading at a fair value compared to its peers, with a Price to Book Value of 1.4 and a Return on Equity (ROE) of 12.2, which makes it attractive to investors.<BR><BR>However, it is important to note that despite the current rise, the stock has experienced significant declines in the past year, with a return of -26.04%, and has shown poor long-term growth with net sales growing at an annual rate of only 6.86% over the last five years. The company has also reported negative results for the last three consecutive quarters, which could impact future performance. Nonetheless, the current upward movement in stock price is primarily driven by increased investor participation and positive short-term performance metrics.

View full answer

Should I buy, sell or hold Insecticides India Ltd?

25-Aug-2026

Who are in the management team of Insecticid.India?

14-Aug-2026

The management team of Insecticid.India includes Hari Chand Aggarwal (Chairman & Wholetime Director), Rajesh Aggarwal (Managing Director), Nikunj Aggarwal, Anil Kumar Goyal (Whole-time Directors), and several Independent Directors, along with Sandeep Kumar as Company Secretary & Compliance Officer. This team combines leadership with independent oversight.

The management team of Insecticid.India includes the following individuals:<BR><BR>1. **Hari Chand Aggarwal** - Chairman & Wholetime Director<BR>2. **Rajesh Aggarwal** - Managing Director<BR>3. **Nikunj Aggarwal** - Whole-time Director<BR>4. **Anil Kurnar Goyal** - Whole-time Director<BR>5. **NAVIN SHAH** - Independent Director<BR>6. **Virjesh Kumar Gupta** - Independent Director<BR>7. **Jayaraman Swaminathan** - Independent Director<BR>8. **Parveen Gupta** - Independent Director<BR>9. **Anil Kumar Bhatia** - Independent Director<BR>10. **Sandeep Kumar** - Company Secretary & Compliance Officer<BR><BR>This team brings a mix of leadership and independent oversight to the company.

View full answer

What does Insecticid.India do?

14-Aug-2026

Insecticides India Ltd is a small-cap company in the Pesticides & Agrochemicals industry, specializing in insecticides and agrochemical products, with net sales of 612 Cr and a net profit of 44 Cr as of June 2026. The company has a market cap of INR 1,806 Cr and a P/E ratio of 15.00.

Overview: <BR>Insecticides India Ltd is a small-cap company operating in the Pesticides & Agrochemicals industry, specializing in the production of insecticides and agrochemical products.<BR><BR>History: <BR>Insecticides India Ltd was originally incorporated as 'Insecticides (India) Private Limited' in 1996 and later converted into a Public Limited Company. The company did not engage in business from December 1996 until October 2001, with commercial production commencing in March 2002. The latest reported quarter for net sales and profit is June 2026.<BR><BR>Financial Snapshot: <BR>Net Sales: 612 Cr (Quarterly Results - Jun 2026) <BR>Net Profit: 44 Cr (Quarterly Results - Jun 2026) <BR>Market Cap: INR 1,806 Cr (Small Cap)<BR><BR>Key Metrics: <BR>P/E: 15.00 <BR>Industry P/E: 27 <BR>Dividend Yield: 0.32% <BR>Debt-Equity: 0.03 <BR>Return on Equity: 12.17% <BR>Price to Book: 1.51 <BR><BR>Contact Details: <BR>Address: 401-402 Lusa Tower, Azadpur Commercial Complex Delhi Delhi : 110033 <BR>Tel: 91-11-27671990-04 <BR>Email: investor@insecticidesindia.com <BR>Website: http://www.insecticidesindia.com

View full answer

Who are the peers of the Insecticid.India?

14-Aug-2026

Insecticid.India's peers include Rallis India, NACL Industries, Bhagiradha Chem., Bharat Rasayan, India Pesticides, Meghmani Organi, Astec Lifescienc, Punjab Chemicals, and Dharmaj Crop. Most peers show below-average growth and management risk, with Insecticid.India's 1-year return at -30.54%, better than Bharat Rasayan's -51.89% but worse than Meghmani Organi's -30.58%.

Peers: The peers of Insecticid.India are Rallis India, NACL Industries, Bhagiradha Chem., Bharat Rasayan, India Pesticides, Meghmani Organi., Astec Lifescienc, Punjab Chemicals, and Dharmaj Crop.<BR><BR>Quality Snapshot: Excellent management risk is observed at Rallis India, Bharat Rasayan, Insecticid.India, India Pesticides, and the rest. Average management risk is found at NACL Industries, Bhagiradha Chem., Punjab Chemicals, and Dharmaj Crop. Below Average management risk is noted at Meghmani Organi. and Astec Lifescienc. All peers exhibit Below Average growth except for Dharmaj Crop, which shows Good growth. Capital Structure ratings are Excellent for Rallis India, Bharat Rasayan, Insecticid.India, and India Pesticides, Good for Bhagiradha Chem. and Punjab Chemicals, and Average for Meghmani Organi. and the rest.<BR><BR>Return Snapshot: The peer with the highest 1-year return is Meghmani Organi. at -30.58%, while Bharat Rasayan has the lowest at -51.89%. Insecticid.India's 1-year return of -30.54% is better than Bharat Rasayan's but worse than Meghmani Organi.'s. Additionally, Rallis India, Bharat Rasayan, India Pesticides, Astec Lifescienc, and Punjab Chemicals all have negative six-month returns.

View full answer

How big is Insecticid.India?

14-Aug-2026

As of 14th August, Insecticides India Ltd has a market capitalization of 1,833.16 Cr, with recent Net Sales of 2,060.40 Cr and a Net Profit of 125.18 Cr. Shareholder's Funds are valued at 1,220.41 Cr, and Total Assets amount to 2,000.18 Cr.

As of 14th August, Insecticides India Ltd has a market capitalization of 1,833.16 Cr, categorizing it as a Small Cap company.<BR><BR>In the latest four quarters, the company reported Net Sales of 2,060.40 Cr and a Net Profit of 125.18 Cr.<BR><BR>For the latest annual period ending March 2026, Shareholder's Funds were valued at 1,220.41 Cr, while Total Assets amounted to 2,000.18 Cr.

View full answer

Are Insecticides India Ltd latest results good or bad?

29-May-2026

Insecticides India Ltd's latest results show strong revenue growth of 18.76% year-on-year, reaching ₹426.26 crore, but net profit fell by 15.69% to ₹11.71 crore, with declining margins raising concerns about operational challenges. Investors should be cautious due to the disparity between revenue growth and profitability.

The latest results for Insecticides India Ltd present a mixed picture. On one hand, the company achieved a significant revenue growth of 18.76% year-on-year, reaching ₹426.26 crore in Q4 FY26. This indicates strong top-line performance and suggests that demand for its products remains robust.<BR><BR>However, the profitability metrics are concerning. The net profit for the quarter fell by 15.69% year-on-year to ₹11.71 crore, marking a significant decline. Additionally, the operating margin dropped to 6.01%, the lowest in eight quarters, which raises questions about cost management and pricing power in a competitive market. The profit after tax margin also decreased to 2.75%, down from 3.87% in the same quarter last year.<BR><BR>Overall, while the revenue growth is a positive sign, the decline in net profit and margins indicates operational challenges that could affect the company's financial health moving forward. Investors may need to be cautious, as the divergence between revenue growth and profitability suggests underlying issues that need to be addressed.

View full answer

Has Insecticides India Ltd declared dividend?

01-Feb-2026

Yes, Insecticides India Ltd has declared a 20% dividend, amounting to ₹2 per share, with an ex-date of February 6, 2026. While recent total returns have been negative, longer-term performance shows significant growth, particularly a 93.57% total return over the past five years.

Insecticides India Ltd has declared a dividend.<BR><BR>Dividend Details:<BR>- Percentage announced: 20%<BR>- Amount per share: 2<BR>- Ex-date: 06 Feb 26<BR><BR>Dividend Yield: 0%<BR><BR>Total Returns by Period:<BR>In the 3-month period, the price return was -16.61%, the dividend return was 0.28%, resulting in a total return of -16.33%.<BR><BR>In the 6-month period, the price return was -43.79%, the dividend return was 0.19%, leading to a total return of -43.6%.<BR><BR>Over the 1-year period, the price return was -4.29%, the dividend return was 0.32%, which resulted in a total return of -3.97%.<BR><BR>In the 2-year period, the price return was -6.92%, the dividend return was 0.71%, culminating in a total return of -6.21%.<BR><BR>During the 3-year period, the price return was 4.63%, the dividend return was 1.75%, resulting in a total return of 6.38%.<BR><BR>In the 4-year period, the price return was 28.32%, the dividend return was 3.10%, leading to a total return of 31.42%.<BR><BR>For the 5-year period, the price return was 89.25%, the dividend return was 4.32%, resulting in a total return of 93.57%.<BR><BR>Overall, while Insecticides India Ltd has declared a dividend, the total returns over the shorter periods have been negative, indicating a challenging performance in the recent past. However, the longer-term returns show significant growth, particularly over the 5-year period.

View full answer

Is Insecticid.India technically bullish or bearish?

03-Dec-2025

As of December 2, 2025, the market trend has shifted to a bearish stance with moderate strength, indicated by bearish MACD, Bollinger Bands, moving averages, and KST on various time frames, alongside a lack of trend signals in Dow Theory and OBV.

As of 2 December 2025, the technical trend has changed from mildly bearish to bearish. The current stance is bearish with moderate strength. Key indicators driving this include a bearish MACD on the weekly chart, bearish Bollinger Bands on both weekly and monthly time frames, and bearish moving averages on the daily chart. The KST is also bearish on the weekly chart, contributing to the overall bearish sentiment. The lack of trend signals in the Dow Theory and OBV further supports the bearish outlook.

View full answer

Is Insecticid.India overvalued or undervalued?

14-Nov-2025

As of November 13, 2025, Insecticid.India's valuation has shifted from very attractive to attractive, indicating it is undervalued with a PE ratio of 13.04, an EV to EBITDA of 9.20, and a PEG ratio of 0.85, especially when compared to peers like UPL and P I Industries, despite a recent 1-year return of -12.71% against the Sensex's 8.74%.

As of 13 November 2025, the valuation grade for Insecticid.India has moved from very attractive to attractive. Based on the analysis, the company appears to be undervalued. The key ratios indicate a PE ratio of 13.04, an EV to EBITDA of 9.20, and a PEG ratio of 0.85, all of which suggest a favorable valuation compared to its peers.<BR><BR>Insecticid.India's valuation can be compared to UPL, which has a PE ratio of 26.8, and P I Industries, which is considered very expensive with a PE of 35.84. These comparisons highlight that Insecticid.India is trading at a significantly lower valuation relative to its peers in the pesticides and agrochemicals industry. Despite recent underperformance against the Sensex, with a 1-year return of -12.71% compared to the Sensex's 8.74%, the company's fundamentals suggest it is positioned for potential growth.

View full answer

How has been the historical performance of Insecticid.India?

13-Nov-2025

Insecticid.India has shown steady growth in net sales and profitability, with net sales increasing from 1,193.51 Cr in Mar'19 to 1,999.95 Cr in Mar'25, and profit after tax rising from 62.98 Cr to 141.45 Cr in the same period, despite rising operational costs. Total assets also grew to 1,898.15 Cr in Mar'25, indicating a positive overall financial trajectory.

Answer:<BR>The historical performance of Insecticid.India shows a steady growth in net sales and profitability over the years, with significant fluctuations in certain metrics.<BR><BR>Breakdown:<BR>Insecticid.India's net sales have increased from 1,193.51 Cr in Mar'19 to 1,999.95 Cr in Mar'25, reflecting a consistent upward trend. Total operating income followed a similar trajectory, reaching 1,999.95 Cr in Mar'25 from 1,801.33 Cr in Mar'23. However, total expenditure saw a rise to 1,778.74 Cr in Mar'25 from 1,679.44 Cr in Mar'23, indicating increased operational costs. The operating profit (PBDIT) has shown improvement, rising to 228.21 Cr in Mar'25 from 123.15 Cr in Mar'23, while profit before tax also increased to 192.20 Cr in Mar'25 from 83.60 Cr in Mar'23. Consequently, profit after tax reached 141.45 Cr in Mar'25, up from 62.98 Cr in Mar'23. The company's total assets grew to 1,898.15 Cr in Mar'25 from 1,696.31 Cr in Mar'23, while total liabilities increased to 1,898.15 Cr in Mar'25 from 1,719.22 Cr in Mar'24. Cash flow from operating activities improved significantly, resulting in a net cash inflow of 42.00 Cr in Mar'24, compared to a net outflow of 17.00 Cr in Mar'23. Overall, Insecticid.India has demonstrated a positive growth trajectory in sales and profits, despite some fluctuations in expenses and liabilities.

View full answer

Who are the top shareholders of the Insecticid.India?

17-Jul-2025

The top shareholders of Insecticid.India include Rajesh Kumar Aggarwal with 16.63%, HDFC Small Cap Fund at 9.07%, and individual investors holding 10.43%. Foreign Institutional Investors collectively own 4.49%, with no pledged promoter holdings reported.

The top shareholders of Insecticid.India include the promoters, with Rajesh Kumar Aggarwal holding the highest individual stake at 16.63%. Additionally, mutual funds have a significant presence, with HDFC Small Cap Fund being the highest public shareholder at 9.07%. Foreign Institutional Investors (FIIs) collectively hold 4.49% through 45 different entities. Individual investors also have a notable share, accounting for 10.43% of the holdings. There are no pledged promoter holdings reported.

View full answer

When is the next results date for Insecticid.India?

06-Jun-2025

No Upcoming Board Meetings

What is the bonus history of the Insecticid.India?

06-Jun-2025

Insecticides India Ltd has a history of issuing bonus shares, with the most recent being a 1:2 bonus announced on September 30, 2022, and a previous 1:2 bonus issued on April 17, 2015. This reflects the company's commitment to rewarding its shareholders.

Insecticides India Ltd has a history of bonus issues. The most recent bonus was a 1:2 issue, which was announced with an ex-date of September 30, 2022, and the record date was October 3, 2022. Prior to that, the company also issued a bonus in a 1:2 ratio on April 17, 2015, with an ex-date of April 16, 2015. This indicates that the company has consistently rewarded its shareholders with bonus shares in the past.

View full answer
iScoreScore
Click here to find our call on this stock
Strong Sell
Sell
Hold
Buy
Strong Buy

Dashboard

1

Poor long term growth as Net Sales has grown by an annual rate of 6.86% and Operating profit at 5.83% over the last 5 years

 
2

The company has declared Negative results for the last 3 consecutive quarters

3

Below par performance in long term as well as near term

stock-summaryMojo Parameters

Mojo Parameters

Loading Valuation Snapshot...

Stock DNA

stock-summary
Industry

Pesticides & Agrochemicals

stock-summary
Market cap

INR 1,723 Cr (Small Cap)

stock-summary
P/E

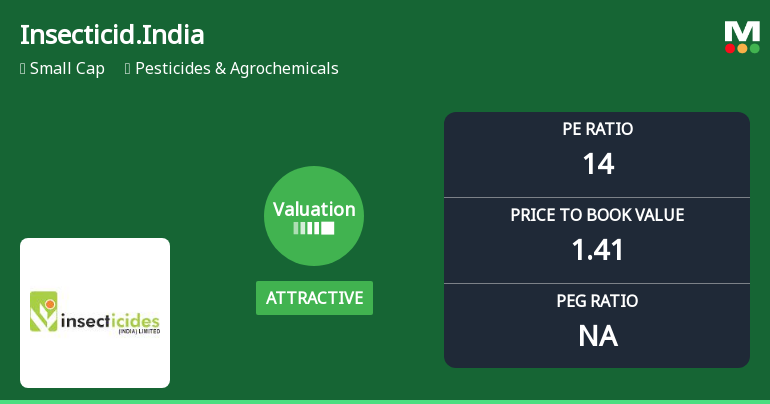
14.00

stock-summary
Industry P/E

26

stock-summary
Dividend Yield

0.34%

stock-summary
Debt Equity

0.03

stock-summary
Return on Equity

12.17%

stock-summary
Price to Book

1.41

Revenue and Profits:
Net Sales:
612 Cr
(Quarterly Results - Jun 2026)
Net Profit:
44 Cr
stock-summaryTotal Returns
Total Returns (Price + Dividend) stock-summary
Dividend Yield (0.34%)
TimePeriod
Price Return
Dividend Return
Total Return
3 Months
-19.52%
0%
-19.52%
6 Months
-3.53%
0%
-3.53%
1 Year
-28.29%
0.25%
-28.04%
2 Years
-40.47%
0.21%
-40.26%
3 Years
20.45%
1.46%
21.91%
4 Years
-12.24%
1.49%
-10.75%
5 Years
15.78%
2.62%
18.4%

Latest dividend: 2 per share ex-dividend date: Feb-06-2026

Risk Adjusted Returns v/s stock-summary
Returns Beta
Icon
Beta has not been calculated since enough price history is not available
stock-summaryNews & Corporate Actions

News

Insecticides India Ltd Declines 2.14% Despite Intraday Surge: Valuation and Volatility in Focus

Announcements stock-summary

Insecticides (India) Limited - Outcome of Board Meeting

14-Nov-2019 | Source : NSE

Insecticides (India) Limited has informed the Exchange regarding Board meeting held on November 13, 2019.

Insecticides (India) Limited - Investor Presentation

13-Nov-2019 | Source : NSE

Insecticides (India) Limited has informed the Exchange regarding Investor Presentation

Shareholders meeting

03-Aug-2019 | Source : NSE

Insecticides (India) Limited has submitted the Exchange a copy Srutinizers report of Annual General Meeting held on August 08, 2018. Further, the company has informed the Exchange regarding voting results.

Corporate Actions stock-summary

stock-summary
BOARD MEETING

No Upcoming Board Meetings

stock-summary
DIVIDEND

Insecticides India Ltd has declared 20% dividend, ex-date: 06 Feb 26

stock-summary
SPLITS

No Splits history available

stock-summary
BONUS

Insecticides India Ltd has announced 1:2 bonus issue, ex-date: 30 Sep 22

stock-summary
RIGHTS

No Rights history available

stock-summaryKey Factors

Quality key factors stock-summary

Factor
Value
Sales Growth (5y)
6.86%
EBIT Growth (5y)
5.83%
EBIT to Interest (avg)
16.03
Debt to EBITDA (avg)
0.90
Net Debt to Equity (avg)
0.03
Sales to Capital Employed (avg)
1.58
Tax Ratio
25.51%
Dividend Payout Ratio
4.17%
Pledged Shares
0
Institutional Holding
13.66%
ROCE (avg)
13.36%
ROE (avg)
10.78%

Valuation key factors

Factor
Value
P/E Ratio
14
Industry P/E
26
Price to Book Value
1.41
EV to EBIT
10.25
EV to EBITDA
8.40
EV to Capital Employed
1.40
EV to Sales
0.86
PEG Ratio
NA
Dividend Yield
0.34%
ROCE (Latest)
16.04%
ROE (Latest)
12.17%

Technicals key factors

Indicator
Weekly
Monthly
MACD
Bearish
Bearish
RSI
No Signal
No Signal
Bollinger Bands
Bearish
Bearish
Moving Averages
Bearish (Daily)
KST
Bearish
Bearish
Dow Theory
Mildly Bearish
Mildly Bearish
OBV
Mildly Bearish
Mildly Bearish
stock-summary Technical Indicator Scale: Bearish, Mildly Bearish, Sideways, Mildly Bullish, Bullish  Turned 
stock-summaryShareholding
Shareholding Snapshot : Jun 2026stock-summary
Shareholding Compare (%holding) stock-summary
Majority shareholders

Promoters

Pledged Promoter Holdings

None

Mutual Funds

Held by 2 Schemes (8.93%)

FIIs

Held by 41 FIIs (4.4%)

Promoter with highest holding

Sanskriti Family Trust (through Mr. Hari Chand Aggarwal The First Trustee) (64.66%)

Highest Public shareholder

Hdfc Small Cap Fund (8.93%)

Individual Investors Holdings

10.83%

stock-summaryFinancial
[
  {
    "link": "quarterly",
    "btn_text": "All Quarterly Results",
    "header": "Quarterly Results Snapshot (Consolidated) - Jun'26 - YoY",
    "rhs": [
      {
        "prefix": "Net Sales ",
        "suffix": "YoY Growth in quarter ended Jun 2026 is -11.52% vs 5.24% in Jun 2025",
        "dir": -1
      },
      {
        "prefix": "Consolidated Net Profit ",
        "suffix": "YoY Growth in quarter ended Jun 2026 is -24.51% vs 17.70% in Jun 2025",
        "dir": -1
      }
    ],
    "table": {
      "header": [
        "Jun'26",
        "Jun'25",
        "Change(%)"
      ],
      "body": [
        {
          "field": "Net Sales",
          "val1": "611.52",
          "val2": "691.13",
          "chgp": "-11.52%",
          "chgp_class": "negative"
        },
        {
          "field": "Operating Profit (PBDIT) excl Other Income",
          "val1": "67.60",
          "val2": "84.58",
          "chgp": "-20.08%",
          "chgp_class": "negative"
        },
        {
          "field": "Interest",
          "val1": "4.69",
          "val2": "3.72",
          "chgp": "26.08%",
          "chgp_class": "negative"
        },
        {
          "field": "Exceptional Items",
          "val1": "0.00",
          "val2": "0.00",
          "chgp": "",
          "chgp_class": "neutral"
        },
        {
          "field": "Consolidate Net Profit",
          "val1": "43.87",
          "val2": "58.11",
          "chgp": "-24.51%",
          "chgp_class": "negative"
        },
        {
          "field": "Operating Profit Margin (Excl OI)",
          "val1": "11.05%",
          "val2": "12.24%",
          "chgp": "-1.19%",
          "chgp_class": "negative"
        }
      ]
    }
  },
  {
    "link": "half-yearly",
    "btn_text": "All Half Yearly Results",
    "header": "Half Yearly Results Snapshot (Consolidated) - Sep'25",
    "rhs": [
      {
        "prefix": "Net Sales ",
        "suffix": " Growth in half year ended Sep 2025 is 3.51% vs -3.90% in Sep 2024",
        "dir": 1
      },
      {
        "prefix": "Consolidated Net Profit ",
        "suffix": " Growth in half year ended Sep 2025 is 6.06% vs 34.29% in Sep 2024",
        "dir": -1
      }
    ],
    "table": {
      "header": [
        "Sep'25",
        "Sep'24",
        "Change(%)"
      ],
      "body": [
        {
          "field": "Net Sales",
          "val1": "1,328.83",
          "val2": "1,283.78",
          "chgp": "3.51%",
          "chgp_class": "positive"
        },
        {
          "field": "Operating Profit (PBDIT) excl Other Income",
          "val1": "174.06",
          "val2": "161.07",
          "chgp": "8.06%",
          "chgp_class": "positive"
        },
        {
          "field": "Interest",
          "val1": "7.88",
          "val2": "3.32",
          "chgp": "137.35%",
          "chgp_class": "negative"
        },
        {
          "field": "Exceptional Items",
          "val1": "0.00",
          "val2": "0.00",
          "chgp": "",
          "chgp_class": "neutral"
        },
        {
          "field": "Consolidate Net Profit",
          "val1": "117.21",
          "val2": "110.51",
          "chgp": "6.06%",
          "chgp_class": "positive"
        },
        {
          "field": "Operating Profit Margin (Excl OI)",
          "val1": "13.10%",
          "val2": "12.55%",
          "chgp": "0.55%",
          "chgp_class": "positive"
        }
      ]
    }
  },
  {
    "link": "nine-monthly",
    "btn_text": "All Nine Monthly Results",
    "header": "Nine Monthly Results Snapshot (Consolidated) - Dec'25",
    "rhs": [
      {
        "prefix": "Net Sales ",
        "suffix": "YoY Growth in nine months ended Dec 2025 is 4.40% vs -3.09% in Dec 2024",
        "dir": 1
      },
      {
        "prefix": "Consolidated Net Profit ",
        "suffix": "YoY Growth in nine months ended Dec 2025 is -0.14% vs 35.18% in Dec 2024",
        "dir": -1
      }
    ],
    "table": {
      "header": [
        "Dec'25",
        "Dec'24",
        "Change(%)"
      ],
      "body": [
        {
          "field": "Net Sales",
          "val1": "1,713.75",
          "val2": "1,641.48",
          "chgp": "4.40%",
          "chgp_class": "positive"
        },
        {
          "field": "Operating Profit (PBDIT) excl Other Income",
          "val1": "201.45",
          "val2": "191.96",
          "chgp": "4.94%",
          "chgp_class": "positive"
        },
        {
          "field": "Interest",
          "val1": "12.56",
          "val2": "4.73",
          "chgp": "165.54%",
          "chgp_class": "negative"
        },
        {
          "field": "Exceptional Items",
          "val1": "0.00",
          "val2": "0.00",
          "chgp": "",
          "chgp_class": "neutral"
        },
        {
          "field": "Consolidate Net Profit",
          "val1": "127.70",
          "val2": "127.88",
          "chgp": "-0.14%",
          "chgp_class": "negative"
        },
        {
          "field": "Operating Profit Margin (Excl OI)",
          "val1": "11.75%",
          "val2": "11.69%",
          "chgp": "0.06%",
          "chgp_class": "positive"
        }
      ]
    }
  },
  {
    "link": "annual",
    "btn_text": "All Annual Results",
    "header": "Annual Results Snapshot (Consolidated) - Mar'26",
    "rhs": [
      {
        "prefix": "Net Sales ",
        "suffix": "YoY Growth in year ended Mar 2026 is 7.00% vs 1.71% in Mar 2025",
        "dir": 1
      },
      {
        "prefix": "Consolidated Net Profit ",
        "suffix": "YoY Growth in year ended Mar 2026 is -1.84% vs 38.73% in Mar 2025",
        "dir": -1
      }
    ],
    "table": {
      "header": [
        "Mar'26",
        "Mar'25",
        "Change(%)"
      ],
      "body": [
        {
          "field": "Net Sales",
          "val1": "2,140.01",
          "val2": "1,999.95",
          "chgp": "7.00%",
          "chgp_class": "positive"
        },
        {
          "field": "Operating Profit (PBDIT) excl Other Income",
          "val1": "227.05",
          "val2": "221.21",
          "chgp": "2.64%",
          "chgp_class": "positive"
        },
        {
          "field": "Interest",
          "val1": "16.88",
          "val2": "6.86",
          "chgp": "146.06%",
          "chgp_class": "negative"
        },
        {
          "field": "Exceptional Items",
          "val1": "0.00",
          "val2": "0.00",
          "chgp": "",
          "chgp_class": "neutral"
        },
        {
          "field": "Consolidate Net Profit",
          "val1": "139.41",
          "val2": "142.02",
          "chgp": "-1.84%",
          "chgp_class": "negative"
        },
        {
          "field": "Operating Profit Margin (Excl OI)",
          "val1": "10.61%",
          "val2": "11.06%",
          "chgp": "-0.45%",
          "chgp_class": "negative"
        }
      ]
    }
  }
]

Quarterly Results Snapshot (Consolidated) - Jun'26 - YoYstock-summary

Jun'26
Jun'25
Change(%)
Net Sales
611.52
691.13
-11.52%
Operating Profit (PBDIT) excl Other Income
67.60
84.58
-20.08%
Interest
4.69
3.72
26.08%
Exceptional Items
0.00
0.00
Consolidate Net Profit
43.87
58.11
-24.51%
Operating Profit Margin (Excl OI)
11.05%
12.24%
-1.19%
Values in Rs Cr.
Direction Arrows
Net Sales

YoY Growth in quarter ended Jun 2026 is -11.52% vs 5.24% in Jun 2025

Direction Arrows
Consolidated Net Profit

YoY Growth in quarter ended Jun 2026 is -24.51% vs 17.70% in Jun 2025

Half Yearly Results Snapshot (Consolidated) - Sep'25stock-summary

Sep'25
Sep'24
Change(%)
Net Sales
1,328.83
1,283.78
3.51%
Operating Profit (PBDIT) excl Other Income
174.06
161.07
8.06%
Interest
7.88
3.32
137.35%
Exceptional Items
0.00
0.00
Consolidate Net Profit
117.21
110.51
6.06%
Operating Profit Margin (Excl OI)
13.10%
12.55%
0.55%
Values in Rs Cr.
Direction Arrows
Net Sales

Growth in half year ended Sep 2025 is 3.51% vs -3.90% in Sep 2024

Direction Arrows
Consolidated Net Profit

Growth in half year ended Sep 2025 is 6.06% vs 34.29% in Sep 2024

Nine Monthly Results Snapshot (Consolidated) - Dec'25stock-summary

Dec'25
Dec'24
Change(%)
Net Sales
1,713.75
1,641.48
4.40%
Operating Profit (PBDIT) excl Other Income
201.45
191.96
4.94%
Interest
12.56
4.73
165.54%
Exceptional Items
0.00
0.00
Consolidate Net Profit
127.70
127.88
-0.14%
Operating Profit Margin (Excl OI)
11.75%
11.69%
0.06%
Values in Rs Cr.
Direction Arrows
Net Sales

YoY Growth in nine months ended Dec 2025 is 4.40% vs -3.09% in Dec 2024

Direction Arrows
Consolidated Net Profit

YoY Growth in nine months ended Dec 2025 is -0.14% vs 35.18% in Dec 2024

Annual Results Snapshot (Consolidated) - Mar'26stock-summary

Mar'26
Mar'25
Change(%)
Net Sales
2,140.01
1,999.95
7.00%
Operating Profit (PBDIT) excl Other Income
227.05
221.21
2.64%
Interest
16.88
6.86
146.06%
Exceptional Items
0.00
0.00
Consolidate Net Profit
139.41
142.02
-1.84%
Operating Profit Margin (Excl OI)
10.61%
11.06%
-0.45%
Values in Rs Cr.
Direction Arrows
Net Sales

YoY Growth in year ended Mar 2026 is 7.00% vs 1.71% in Mar 2025

Direction Arrows
Consolidated Net Profit

YoY Growth in year ended Mar 2026 is -1.84% vs 38.73% in Mar 2025

stock-summaryCompany CV
About Insecticides India Ltd stock-summary
stock-summary
Insecticides India Ltd
Small Cap
Pesticides & Agrochemicals
Insecticides India Limited (IIL) was originally incorporated as 'Insecticides (India) Private Limited' on 18th December 1996. Subsequently, the Company was converted into Public Limited Company. The Company was not carrying out any business from December 1996 till October 2001. The commercial production started in March, 2002 at Chopanki Unit in Rajasthan with an installed capacity of 29.40 Lacs litres of EC, and 2400 MTs of Granules.
Company Coordinates stock-summary
Company Details
401-402 Lusa Tower, Azadpur Commercial Complex Delhi Delhi : 110033
stock-summary
Tel: 91-11-27671990-04
stock-summary
investor@insecticidesindia.com
Registrar Details
Alankit Assignments Ltd , Alankit House , 2 E/21, Jhandewala Extension, New Delhi