
Compare 3P Land Hold. with Similar Stocks
Stock DNA
Non Banking Financial Company (NBFC)
INR 58 Cr (Micro Cap)
27.00
17
0.00%
0.00
2.08%
0.56
Total Returns (Price + Dividend) 
Latest dividend: 0.2 per share ex-dividend date: Aug-18-2010
Risk Adjusted Returns v/s
Returns Beta

News
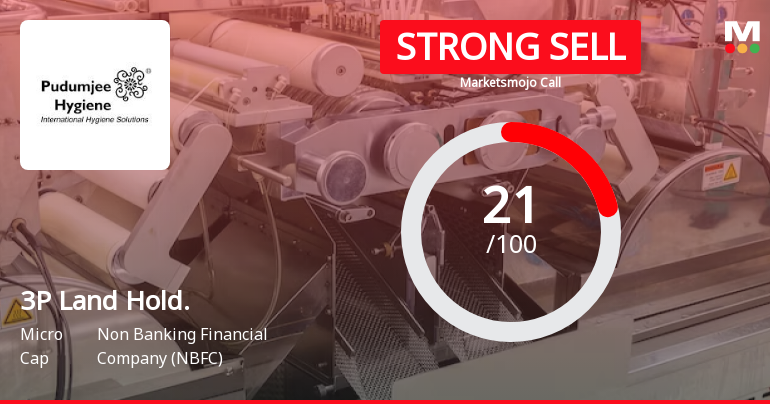
3P Land Holdings Ltd is Rated Strong Sell
3P Land Holdings Ltd is rated Strong Sell by MarketsMOJO, with this rating last updated on 22 August 2025. However, the analysis and financial metrics discussed here reflect the stock's current position as of 17 June 2026, providing investors with an up-to-date view of the company’s fundamentals, valuation, financial trends, and technical outlook.
Read full news article
3P Land Holdings Ltd is Rated Strong Sell
3P Land Holdings Ltd is rated Strong Sell by MarketsMOJO. This rating was last updated on 22 Aug 2025, reflecting a significant reassessment of the stock’s outlook. However, the analysis and financial metrics discussed below represent the company’s current position as of 03 June 2026, providing investors with the latest insights into its performance and valuation.
Read full news article
3P Land Holdings Ltd is Rated Strong Sell
3P Land Holdings Ltd is rated Strong Sell by MarketsMOJO, with this rating last updated on 22 Aug 2025. However, the analysis and financial metrics discussed here reflect the stock’s current position as of 19 May 2026, providing investors with an up-to-date perspective on the company’s fundamentals, valuation, financial trend, and technical outlook.
Read full news article Announcements
3P Land Holdings Limited - Financial Results Updates
23-Oct-2019 | Source : NSE3P Land Holdings Limited has informed the Exchange that Financial Results in for the quarter/half year ended 30th September, 2019, pursuant to your email of 22nd October, 2019 in legible copy.
3P Land Holdings Limited - Outcome of Board Meeting
22-Oct-2019 | Source : NSE3P Land Holdings Limited has informed the Exchange regarding Board meeting held on October 19, 2019.This is to inform you that at the Board Meeting held today, our Board of Directors have taken on record the Statement of Standalone and Consolidated Unaudited Financial Results of the Company for the Quarter and Half Year ended on 30th September, 2019. A copy of the said results together with the Limited Review Reports for the Quarter and Half Year ended on that date are attached for your information and record.
3P Land Holdings Limited - Updates
09-Oct-2019 | Source : NSE3P Land Holdings Limited has informed the Exchange regarding 'Certificate under Regulation 74(5) of the SEBI (Depositories and Participants) Regulations, 2018 for the quarter ended 30th September, 2019.'.
Corporate Actions

No Upcoming Board Meetings

3P Land Holdings Ltd has declared 10% dividend, ex-date: 18 Aug 10

3P Land Holdings Ltd has announced 2:10 stock split, ex-date: 11 Mar 08

No Bonus history available

No Rights history available
Quality key factors
Valuation key factors
Technicals key factors
 Technical Indicator Scale: Bearish, Mildly Bearish, Sideways, Mildly Bullish, Bullish Turned
 Shareholding Snapshot : Mar 2026
Shareholding Compare (%holding)
Promoters
None
Held by 0 Schemes
Held by 0 FIIs
Amj Land Holdings Limited (27.24%)
Manju Gaggar (4.52%)
21.51%
Quarterly Results Snapshot (Consolidated) - Mar'26 - QoQ

QoQ Growth in quarter ended Mar 2026 is 4.12% vs -45.51% in Dec 2025
QoQ Growth in quarter ended Mar 2026 is 5.00% vs -59.60% in Dec 2025
Half Yearly Results Snapshot (Consolidated) - Sep'25

Growth in half year ended Sep 2025 is 2.67% vs 47.19% in Sep 2024
Growth in half year ended Sep 2025 is 2.26% vs 25.47% in Sep 2024
Nine Monthly Results Snapshot (Consolidated) - Dec'25
YoY Growth in nine months ended Dec 2025 is 3.10% vs 32.96% in Dec 2024
YoY Growth in nine months ended Dec 2025 is 2.92% vs 17.93% in Dec 2024
Annual Results Snapshot (Consolidated) - Mar'26
YoY Growth in year ended Mar 2026 is 4.47% vs 25.56% in Mar 2025
YoY Growth in year ended Mar 2026 is 4.31% vs 15.47% in Mar 2025
About 3P Land Holdings Ltd

Company Coordinates


