
 Price Point
Compare Orchid Pharma with Similar Stocks
ScoreDashboard
Low ability to service debt as the company has a high Debt to EBITDA ratio of 14.73 times
- Poor long term growth as Operating profit has grown by an annual rate 15.60% of over the last 5 years
- Low ability to service debt as the company has a high Debt to EBITDA ratio of 14.73 times
- The company has been able to generate a Return on Equity (avg) of 4.82% signifying low profitability per unit of shareholders funds
Poor long term growth as Operating profit has grown by an annual rate 15.60% of over the last 5 years
Flat results in Jun 26
With ROCE of -0.9, it has a Very Expensive valuation with a 6.3 Enterprise value to Capital Employed
High Institutional Holdings at 21.55%
Mojo ParametersStock DNA

Pharmaceuticals & Biotechnology

INR 5,867 Cr (Small Cap)

527.00
37

0.00%

0.22

0.71%

7.39
Total ReturnsTotal Returns (Price + Dividend) 
Latest dividend: 654 per share ex-dividend date: Sep-13-2012
Risk Adjusted Returns v/s
Returns Beta
 News & Corporate Actions
News
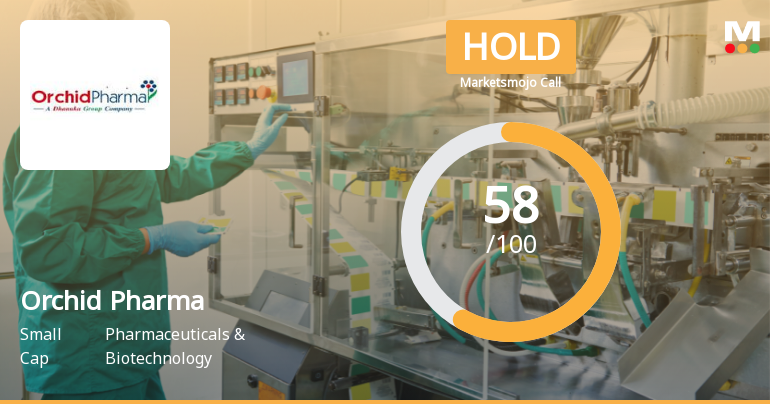
Orchid Pharma Ltd Upgraded to Hold as Quality and Valuation Metrics Improve
Orchid Pharma Ltd has seen its investment rating upgraded from Sell to Hold, reflecting a nuanced shift in its overall outlook. This change is driven by improvements in quality metrics, tempered valuation concerns, mixed financial trends, and cautious technical signals. Despite recent challenges, the company’s long-term market-beating returns and institutional backing have contributed to this reassessment.
Read full news article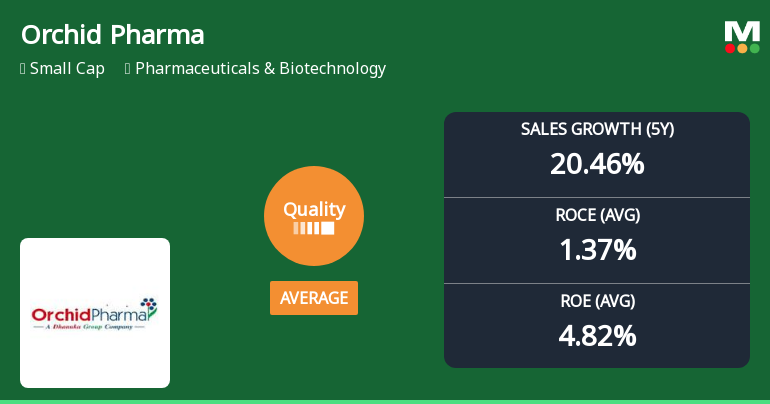
Orchid Pharma Ltd Quality Grade Upgrade Signals Improving Business Fundamentals
Orchid Pharma Ltd has seen its quality grade improve from below average to average, reflecting a nuanced shift in its business fundamentals. While key metrics such as return on equity (ROE) and return on capital employed (ROCE) remain modest, the company’s growth trajectory and debt profile reveal both encouraging and cautionary signals for investors navigating the Pharmaceuticals & Biotechnology sector.
Read full news article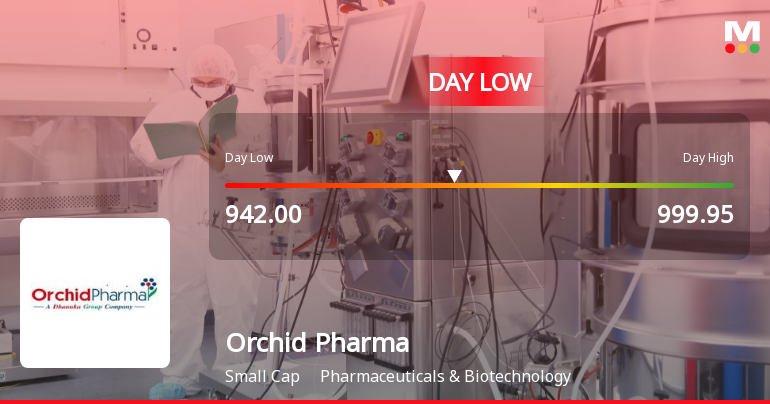
Orchid Pharma Ltd Hits Intraday Low Amid Price Pressure on 17 Aug 2026
Orchid Pharma Ltd experienced significant intraday weakness on 17 Aug 2026, with its stock price touching a low of Rs 942, marking a 10.04% decline from the previous close. The pharmaceutical company faced notable price pressure today, underperforming its sector and broader market indices amid heightened volatility and subdued market sentiment.
Read full news article Announcements
Orchid Pharma Limited - AGM/Book Closure
05-Dec-2019 | Source : NSEOrchid Pharma Limited has informed the Exchange that the Register of Members & Share Transfer Books of the Company will remain closed from December 23, 2019 to December 30, 2019 ( both days inclusive) for the purpose of Annual General Meeting to be held on December 30, 2019.
Orchid Pharma Limited - Outcome of Board Meeting
15-Nov-2019 | Source : NSEOrchid Pharma Limited has informed the Exchange regarding Board meeting held on November 14, 2019.
Outcome of Board Meeting
12-Aug-2019 | Source : NSE
| Orchid Pharma Limited has informed the Exchange regarding Board meeting held on August 12, 2019. |
Corporate Actions

No Upcoming Board Meetings

Orchid Pharma Ltd has declared 30% dividend, ex-date: 13 Sep 12

No Splits history available

No Bonus history available

No Rights history available
Key FactorsQuality key factors
Valuation key factors
Technicals key factors
 Technical Indicator Scale: Bearish, Mildly Bearish, Sideways, Mildly Bullish, Bullish Turned Shareholding
Shareholding Snapshot : Jun 2026
Shareholding Compare (%holding)
Promoters
None
Held by 10 Schemes (19.93%)
Held by 26 FIIs (0.81%)
Dhanuka Laboratories Limited (69.84%)
Quant Mutual Fund - Quant Small Cap Fund (6.83%)
6.21%
FinancialQuarterly Results Snapshot (Consolidated) - Jun'26 - QoQ
 Compare with Peers
QoQ Growth in quarter ended Jun 2026 is -17.42% vs 77.71% in Mar 2026
QoQ Growth in quarter ended Jun 2026 is -87.54% vs 304.92% in Mar 2026

Half Yearly Results Snapshot (Consolidated) - Sep'25
Growth in half year ended Sep 2025 is -21.55% vs 22.38% in Sep 2024
Growth in half year ended Sep 2025 is -83.50% vs 93.74% in Sep 2024
Nine Monthly Results Snapshot (Consolidated) - Dec'25
YoY Growth in nine months ended Dec 2025 is -16.18% vs 13.64% in Dec 2024
YoY Growth in nine months ended Dec 2025 is -104.23% vs 31.94% in Dec 2024
Annual Results Snapshot (Consolidated) - Mar'26

YoY Growth in year ended Mar 2026 is 33.72% vs 12.52% in Mar 2025
YoY Growth in year ended Mar 2026 is -90.01% vs 8.13% in Mar 2025
 Company CV
About Orchid Pharma Ltd

Company Coordinates










