
Compare Cheviot Company with Similar Stocks
Dashboard
The company is Net-Debt Free
Poor long term growth as Net Sales has grown by an annual rate of 6.70% and Operating profit at 7.10% over the last 5 years
With ROE of 7.3, it has a Expensive valuation with a 1 Price to Book Value
Despite the size of the company, domestic mutual funds hold only 0.01% of the company
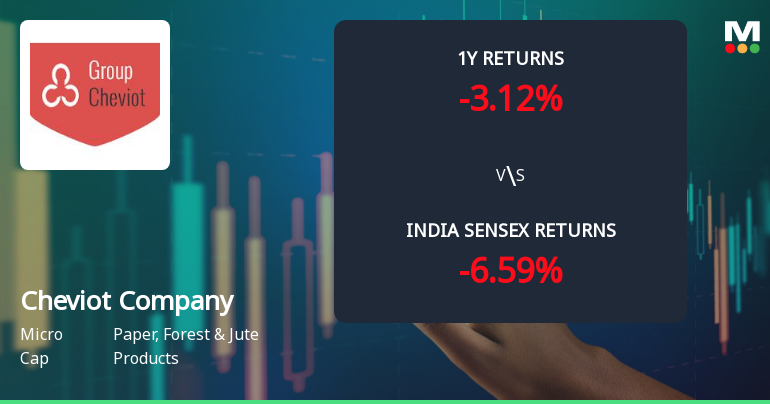
Consistent Underperformance against the benchmark over the last 3 years
Stock DNA
Paper, Forest & Jute Products
INR 669 Cr (Micro Cap)
13.00
26
0.44%
-0.03
7.32%
0.95
Total Returns (Price + Dividend) 
Latest dividend: 5 per share ex-dividend date: Jul-31-2025
Risk Adjusted Returns v/s
Returns Beta

News
Cheviot Company Ltd Technical Momentum Shifts Signal Bullish Outlook
Cheviot Company Ltd, a micro-cap player in the Paper, Forest & Jute Products sector, has witnessed a notable shift in its technical momentum, upgrading from a mildly bullish to a bullish trend. This change is underpinned by improvements across key technical indicators including MACD, moving averages, and Bollinger Bands, signalling renewed investor interest and potential upside in the near term.
Read full news article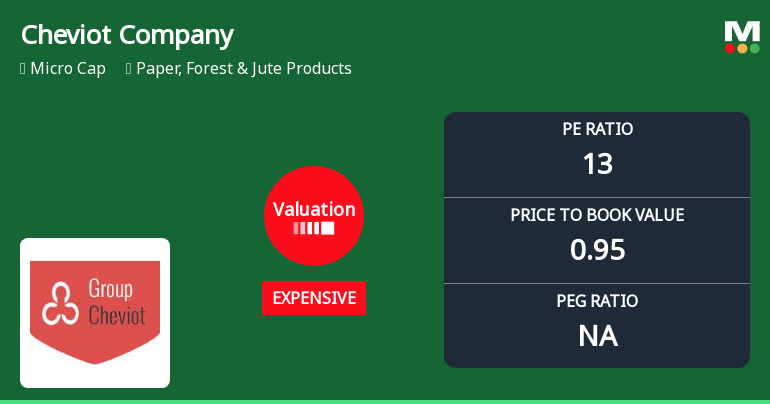
Cheviot Company Ltd Valuation Shifts Signal Changing Market Perception
Cheviot Company Ltd, a micro-cap player in the Paper, Forest & Jute Products sector, has seen a notable shift in its valuation parameters, moving from a fair to an expensive rating. This change, coupled with a recent upgrade in its Mojo Grade from Sell to Hold, reflects evolving investor sentiment amid mixed financial metrics and peer comparisons.
Read full news article
Cheviot Company Ltd is Rated Sell
Cheviot Company Ltd is rated Sell by MarketsMOJO, with this rating last updated on 06 July 2026. However, the analysis and financial metrics discussed here reflect the stock’s current position as of 13 July 2026, providing investors with the latest insights into the company’s performance and outlook.
Read full news article Announcements
Corporate Actions

No Upcoming Board Meetings

Cheviot Company Ltd has declared 250% dividend, ex-date: 30 Jul 26

No Splits history available

Cheviot Company Ltd has announced 1:2 bonus issue, ex-date: 29 Aug 18

No Rights history available
Quality key factors
Valuation key factors
Technicals key factors
 Technical Indicator Scale: Bearish, Mildly Bearish, Sideways, Mildly Bullish, Bullish Turned
 Shareholding Snapshot : Jun 2026
Shareholding Compare (%holding)
Promoters
None
Held by 1 Schemes (0.0%)
Held by 12 FIIs (0.28%)
Harsh Investments Private Limited (70.61%)
None
18.76%
Quarterly Results Snapshot (Standalone) - Mar'26 - YoY

YoY Growth in quarter ended Mar 2026 is 5.10% vs 8.91% in Mar 2025
YoY Growth in quarter ended Mar 2026 is -197.21% vs -37.64% in Mar 2025
Half Yearly Results Snapshot (Standalone) - Sep'25

Growth in half year ended Sep 2025 is 35.62% vs -18.21% in Sep 2024
Growth in half year ended Sep 2025 is -3.20% vs 23.13% in Sep 2024
Nine Monthly Results Snapshot (Standalone) - Dec'25
YoY Growth in nine months ended Dec 2025 is 33.10% vs -10.10% in Dec 2024
YoY Growth in nine months ended Dec 2025 is 25.44% vs -11.07% in Dec 2024
Annual Results Snapshot (Standalone) - Mar'26
YoY Growth in year ended Mar 2026 is 24.57% vs -5.05% in Mar 2025
YoY Growth in year ended Mar 2026 is -10.48% vs -16.79% in Mar 2025
About Cheviot Company Ltd

Company Coordinates


