
 Price Point
Compare Texmaco Rail with Similar Stocks
ScoreDashboard
Company's ability to service its debt is weak with a poor EBIT to Interest (avg) ratio of 1.92
- Company's ability to service its debt is weak with a poor EBIT to Interest (avg) ratio of 1.92
- The company has been able to generate a Return on Equity (avg) of 5.02% signifying low profitability per unit of shareholders funds
Negative results in Jun 26
Falling Participation by Institutional Investors
Below par performance in long term as well as near term
Mojo ParametersStock DNA

Industrial Manufacturing

INR 4,433 Cr (Small Cap)

23.00
33

0.65%

0.20

8.31%

1.94
Total ReturnsTotal Returns (Price + Dividend) 
Latest dividend: 0.75 per share ex-dividend date: Sep-15-2025
Risk Adjusted Returns v/s
Returns Beta
 News & Corporate Actions
News
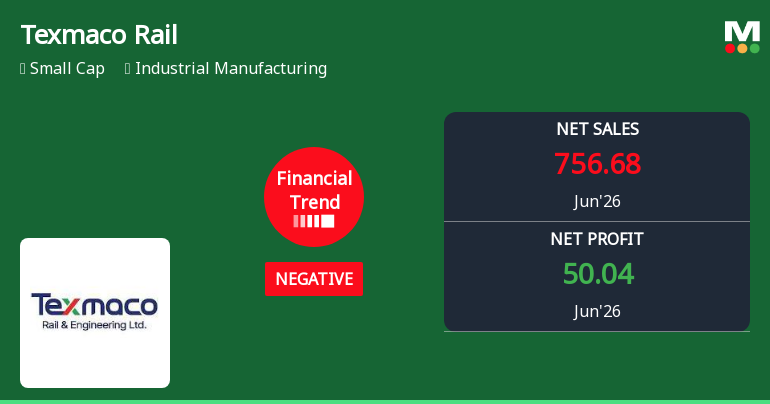
Texmaco Rail & Engineering Ltd Reports Negative Financial Trend Amid Mixed Quarterly Results
Texmaco Rail & Engineering Ltd has reported a marked deterioration in its financial trend for the quarter ended June 2026, shifting from a previously flat trajectory to a negative one. Despite a robust 66.9% growth in quarterly profit after tax (PAT), the company’s overall financial health is under pressure due to declining sales, shrinking margins, and rising leverage, signalling challenges ahead for this industrial manufacturing small-cap.
Read full news article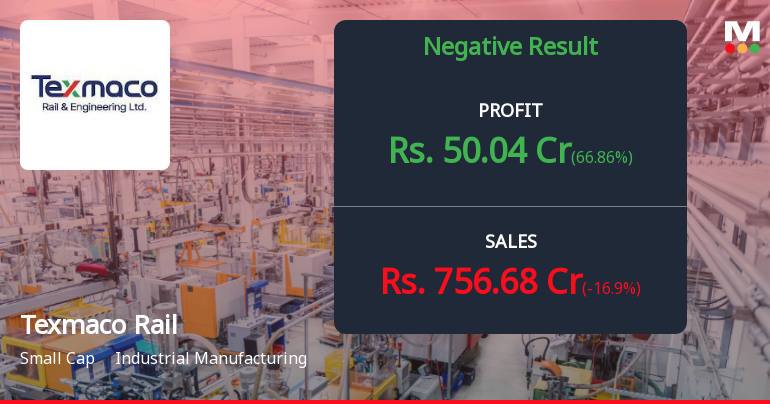
Texmaco Rail Q1 FY27: Revenue Slump and Margin Pressure Cloud Growth Story
Texmaco Rail & Engineering Ltd., a Kolkata-based industrial manufacturing company with a market capitalisation of ₹4,606.00 crores, reported a challenging first quarter for FY2027, with consolidated net profit rising 66.86% year-on-year to ₹50.04 crores but declining 13.25% sequentially from Q4 FY26's ₹57.68 crores. The stock, trading at ₹112.90 as of August 3, 2026, has faced significant headwinds over the past year, declining 21.60% whilst the broader market fell just 2.43%, underscoring persistent operational and execution challenges.
Read full news article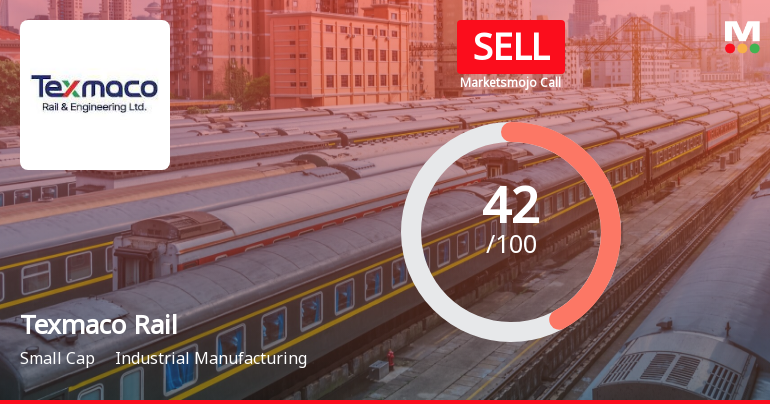
Texmaco Rail & Engineering Ltd is Rated Sell
Texmaco Rail & Engineering Ltd is rated 'Sell' by MarketsMOJO, with this rating last updated on 17 April 2026. However, the analysis and financial metrics discussed here reflect the company’s current position as of 28 July 2026, providing investors with the latest insights into its performance and outlook.
Read full news article Announcements
Texmaco Rail & Engineering Limited - Credit Rating
26-Nov-2019 | Source : NSETexmaco Rail & Engineering Limited has informed the Exchange regarding Credit Rating
Texmaco Rail & Engineering Limited - Voluntary Delistings
23-Oct-2019 | Source : NSETexmaco Rail & Engineering Limited has informed the Exchange about Voluntary Delisting
Committee Meeting Updates
23-Sep-2019 | Source : NSE
| Texmaco Rail & Engineering Limited has informed the Exchange regarding Outcome of Committee Meeting held on September 23, 2019. |
Corporate Actions

No Upcoming Board Meetings

Texmaco Rail & Engineering Ltd has declared 75% dividend, ex-date: 15 Sep 25

No Splits history available

No Bonus history available

Texmaco Rail & Engineering Ltd has announced 2:7 rights issue, ex-date: 21 Oct 21
Key FactorsQuality key factors
Valuation key factors
Technicals key factors
 Technical Indicator Scale: Bearish, Mildly Bearish, Sideways, Mildly Bullish, Bullish Turned Shareholding
Shareholding Snapshot : Jun 2026
Shareholding Compare (%holding)
Promoters
None
Held by 7 Schemes (4.74%)
Held by 60 FIIs (5.01%)
Zuari International Limited (15.67%)
Nippon Life India Trustee Ltd-a/c Nippon India Sma (2.8%)
33.03%
FinancialQuarterly Results Snapshot (Consolidated) - Jun'26 - YoY
 Compare with Peers
YoY Growth in quarter ended Jun 2026 is -16.90% vs -16.32% in Jun 2025

YoY Growth in quarter ended Jun 2026 is 66.86% vs -49.87% in Jun 2025

Half Yearly Results Snapshot (Consolidated) - Sep'25
Growth in half year ended Sep 2025 is -10.90% vs 66.50% in Sep 2024
Growth in half year ended Sep 2025 is -28.69% vs 254.79% in Sep 2024
Nine Monthly Results Snapshot (Consolidated) - Dec'25
YoY Growth in nine months ended Dec 2025 is -14.62% vs 59.45% in Dec 2024
YoY Growth in nine months ended Dec 2025 is -34.36% vs 208.45% in Dec 2024
Annual Results Snapshot (Consolidated) - Mar'26
YoY Growth in year ended Mar 2026 is -14.28% vs 45.78% in Mar 2025
YoY Growth in year ended Mar 2026 is -21.68% vs 120.10% in Mar 2025
 Company CV
About Texmaco Rail & Engineering Ltd

Company Coordinates










