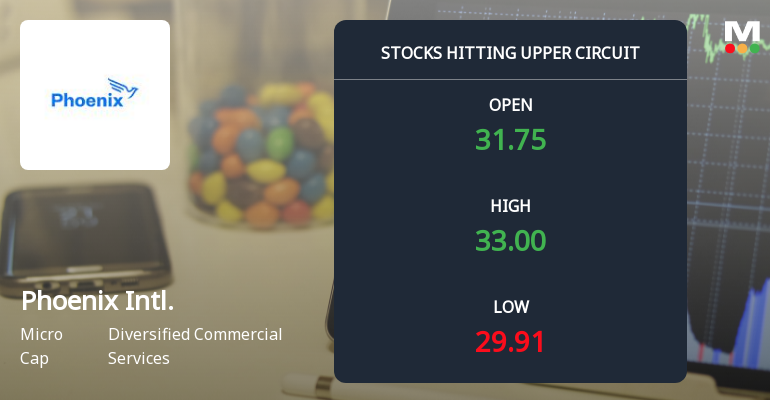
Phoenix Intl.

  • Market Cap: Micro Cap
  • Industry: Diversified Commercial Services
  • ISIN: INE245B01011
  • NSEID: PHOENXINTL
  • BSEID: 526481
INR
31.35
-0.04 (-0.13%)
BSENSE

Sep 03, 12:46 PM

BSE+NSE Vol: 710

  • Price Points
  • Score
  • Mojo Parameters
  • Total Return
  • News and Corporate Actions
  • Key factors
  • Shareholding
  • Financials
  • CompanyCV
stock-summaryPrice Point
High/Low

1Day

52 Week

Valuation
Technical
Day's Volume

CASH

710 (-24.13%) Volume

Shareholding (Jun 2026)

FII

0.00%

Held by 0 FIIs

DII

0.00%

Held by 0 DIIs

Promoter

70.22%

Why is Phoenix International Ltd falling/rising?

03-Sep-2026

As of 02-Sep, the stock price of Phoenix International Ltd is stable at 31.00, with a short-term outperformance against the Sensex. However, it has declined significantly year-to-date and shows decreasing investor interest, indicating challenges for future recovery.

As of 02-Sep, the stock price of Phoenix International Ltd is currently stable at 31.00, with no change recorded. However, the stock has shown a positive performance in the short term, outperforming the benchmark Sensex by 1.74% today. Over the past week, the stock has increased by 3.23%, while the Sensex has declined by 1.17%. <BR><BR>Despite this recent uptick, the stock has experienced a significant decline year-to-date, down 21.88%, compared to a 10.15% drop in the Sensex. Additionally, over the past year, the stock has decreased by 21.02, while the Sensex has only fallen by 4.48%. <BR><BR>Investor participation appears to be declining, as indicated by a substantial drop in delivery volume, which fell by 82.34% against the 5-day average. This suggests that while the stock may have shown some short-term resilience, the overall trend indicates a lack of sustained investor interest, which could be a contributing factor to its long-term decline. <BR><BR>In summary, while Phoenix International Ltd has seen a slight rise in the short term, the overall performance metrics and declining investor participation suggest that the stock is facing challenges that could hinder its recovery.

View full answer

Who are in the management team of Phoenix Intl.?

01-Sep-2026

The management team of Phoenix International includes Narendra Aggarwal (Independent Non-Executive Director), Narender Makkar (Executive Director, CFO, and Company Secretary), Paruvatharayil Mathai Alexander (Chairman and Non-Executive Director), Pushpa Joshi (Independent Non-Executive Director), and Jitendra Kumar Pancharia (Independent Non-Executive Director).

The management team of Phoenix International includes the following members:<BR><BR>1. **Narendra Aggarwal** - Independent Non-Executive Director<BR>2. **Narender Makkar** - Executive Director, Chief Financial Officer, and Company Secretary<BR>3. **Paruvatharayil Mathai Alexander** - Chairman and Non-Executive Director<BR>4. **Pushpa Joshi** - Independent Non-Executive Director<BR>5. **Jitendra Kumar Pancharia** - Independent Non-Executive Director<BR><BR>If you need more information about any specific member or their roles, feel free to ask!

View full answer

What does Phoenix Intl. do?

01-Sep-2026

Phoenix International Ltd is a micro-cap company that manufactures shoe uppers and leases buildings, with net sales of 8 Cr and a net profit of 1 Cr as of June 2026. It has a market cap of INR 55 Cr and key financial metrics include a P/E ratio of 20.00 and a debt-equity ratio of 0.13.

Overview: <BR>Phoenix International Ltd is a manufacturer and supplier of shoe uppers and is involved in leasing buildings, operating within the diversified commercial services industry and categorized as a micro-cap company.<BR><BR>History: <BR>Incorporated as a private limited company in December 1987, Phoenix International was converted into a public limited company in June 1988. The company reported its latest quarterly results for June 2026, showing net sales and profit figures.<BR><BR>Financial Snapshot: <BR>Net Sales: 8 Cr (Quarterly Results - Jun 2026) <BR>Net Profit: 1 Cr (Quarterly Results - Jun 2026) <BR>Market Cap: INR 55 Cr (Micro Cap)<BR><BR>Key Metrics: <BR>P/E: 20.00 <BR>Industry P/E: 16 <BR>Dividend Yield: 0.00% <BR>Debt-Equity: 0.13 <BR>Return on Equity: 0.71% <BR>Price to Book: 0.15 <BR><BR>Contact Details: <BR>Address: 3rd Floor Gopala Tower, 25 Rajendra Place, New Delhi, New Delhi: 110008 <BR>Email: gopala@phoenixindia.com <BR>Website: http://www.phoenixindia.com

View full answer

Who are the peers of the Phoenix Intl.?

01-Sep-2026

Phoenix Intl.'s peers include Satchmo Holdings, Mangal Compuso., Icon Facil., Rithwik Facility, SVC Industries, Evans Electric, and Happy Square. Management risk is below average for Phoenix Intl. and several peers, with Icon Facil. showing good management and the highest 1-year return at 39.33%, while Phoenix Intl. has a return of -14.97%.

Peers: The peers of Phoenix Intl. are Satchmo Holdings, Mangal Compuso., Icon Facil., Rithwik Facility, SVC Industries, Evans Electric, and Happy Square.<BR><BR>Quality Snapshot: Below Average management risk is observed at Satchmo Holdings, Phoenix Intl., SVC Industries, and the rest. Average management risk is found at Mangal Compuso., Rithwik Facility, and Evans Electric, while Good management risk is noted at Icon Facil. and Happy Square. Growth is rated as Good at Mangal Compuso. and Happy Square, while Below Average growth is seen at Satchmo Holdings, Phoenix Intl., SVC Industries, and the rest. Average growth is observed at Rithwik Facility, while Icon Facil. has Below Average growth. Capital Structure is Good at Icon Facil. and Evans Electric, while Average is noted at Mangal Compuso. and Rithwik Facility, and Below Average at Satchmo Holdings, Phoenix Intl., SVC Industries, and the rest.<BR><BR>Return Snapshot: Icon Facil. has the highest 1-year return at 39.33%, while Evans Electric has the lowest at -53.12%. Phoenix Intl.'s 1-year return of -14.97% is better than Evans Electric's but worse than Icon Facil.'s. Additionally, Evans Electric and SVC Industries have negative six-month returns.

View full answer

How big is Phoenix Intl.?

01-Sep-2026

As of 31st August, Phoenix International Ltd has a market capitalization of 55.00 Cr, with recent Net Sales of 28.98 Cr and a Net Profit of 2.77 Cr. Shareholder's Funds are 349.58 Cr and Total Assets amount to 442.46 Cr as of March 2025.

As of 31st August, Phoenix International Ltd has a market capitalization of 55.00 Cr, classified as a Micro Cap.<BR><BR>In the latest four quarters, the company reported Net Sales of 28.98 Cr and a Net Profit of 2.77 Cr.<BR><BR>The latest annual period for the balance sheet is March 2025, with Shareholder's Funds amounting to 349.58 Cr and Total Assets of 442.46 Cr.

View full answer

Should I buy, sell or hold Phoenix International Ltd?

16-Aug-2026

When is the next results date for Phoenix International Ltd?

12-Aug-2026

The next results date for Phoenix International Ltd is 14 August 2026.

The next results date for Phoenix International Ltd is scheduled for 14 August 2026.

View full answer

Are Phoenix International Ltd latest results good or bad?

02-Jun-2026

Phoenix International Ltd's latest results show strong revenue growth of 9.91% quarter-over-quarter, but the company reported a net loss of ₹0.48 crores due to a high tax expense, raising concerns about profitability and operational efficiency. Investors should be cautious given these mixed signals.

Phoenix International Ltd's latest results present a mixed picture. On one hand, the company achieved a notable revenue growth of 9.91% quarter-over-quarter, reaching ₹7.43 crores, which represents a year-on-year increase of 20.81%. This is a positive sign indicating potential stabilization in its core operations.<BR><BR>However, the net profit situation is concerning. The company reported a net loss of ₹0.48 crores, marking a dramatic decline of 328.57% compared to the previous quarter. This loss was largely driven by an extraordinary tax expense that resulted in an effective tax rate of 150%, which significantly impacted profitability. The operating margin also fell sharply to 44.41%, down from 54.44% in the previous quarter, indicating deteriorating operational efficiency.<BR><BR>Overall, while revenue growth is a positive aspect, the substantial loss and declining margins raise serious concerns about the company's profitability and operational challenges. Investors should be cautious, as these factors suggest underlying issues that could affect future performance.

View full answer

Is Phoenix Intl. overvalued or undervalued?

05-Dec-2025

As of December 4, 2025, Phoenix International is considered very attractive and undervalued, with a PE ratio of 19.47 and a low PEG ratio of 0.77, outperforming peers like Mayur Uniquoters and significantly exceeding its long-term return of 177.66% despite short-term underperformance against the Sensex.

As of 4 December 2025, the valuation grade for Phoenix International has moved from fair to very attractive, indicating a significant improvement in its perceived value. The company is currently undervalued, especially when considering its key financial ratios. The PE ratio stands at 19.47, while the EV to EBITDA ratio is 8.57, and the PEG ratio is notably low at 0.77, suggesting that the stock is priced attractively relative to its growth potential.<BR><BR>In comparison to its peers, Phoenix International outperforms Mayur Uniquoters, which has a PE ratio of 14.14 and an EV to EBITDA of 10.09, despite both being rated as very attractive. Sarup Industries, on the other hand, is rated as risky with a PE ratio of 69.91, highlighting the disparity in valuation within the industry. While the stock has underperformed against the Sensex in the short term, its long-term performance over five years shows a robust return of 177.66%, reinforcing the argument for its current undervaluation.

View full answer

How has been the historical performance of Phoenix Intl.?

14-Nov-2025

Phoenix Intl. has faced declining net sales and total operating income from INR 32.37 crore in March 2023 to INR 24.04 crore in March 2025, while operating profit showed slight stability. Despite improvements in profit before tax, profit after tax decreased, indicating challenges in revenue generation and profitability.

Answer:<BR>The historical performance of Phoenix Intl. shows a fluctuating trend in key financial metrics over the years.<BR><BR>Breakdown:<BR>Phoenix Intl. has experienced a decline in net sales from INR 32.37 crore in March 2023 to INR 24.04 crore in March 2025. The total operating income followed a similar trend, decreasing from INR 32.37 crore in March 2023 to INR 24.04 crore in March 2025. The total expenditure, excluding depreciation, also decreased from INR 19.73 crore in March 2023 to INR 10.51 crore in March 2025. Operating profit (PBDIT) has shown some stability, with a slight increase from INR 12.64 crore in March 2023 to INR 13.53 crore in March 2025. Profit before tax improved from INR 2.79 crore in March 2023 to INR 3.75 crore in March 2025, while profit after tax saw a decrease from INR 2.16 crore in March 2023 to INR 1.57 crore in March 2025. The company's total assets decreased from INR 468.94 crore in March 2023 to INR 442.46 crore in March 2025, and total liabilities also declined from INR 468.94 crore to INR 442.46 crore during the same period. Cash flow from operating activities remained relatively stable, with INR 19 crore in March 2025 compared to INR 18 crore in March 2023, while cash flow from financing activities showed a negative trend, increasing from -INR 16 crore in March 2023 to -INR 20 crore in March 2025. Overall, the financial performance indicates challenges in revenue generation and profitability, despite some improvements in operational efficiency.

View full answer

Who are the top shareholders of the Phoenix Intl.?

17-Jul-2025

The top shareholders of Phoenix International are Vanguard Services Pvt Ltd with 18.58%, followed by public shareholder Anil Aggarwal at 2.95%. Individual investors collectively own 19.19%, with no holdings from mutual funds or foreign institutional investors.

The top shareholders of Phoenix International include Vanguard Services Pvt Ltd, which holds the highest stake at 18.58%. Other notable shareholders include Anil Aggarwal, who is the highest public shareholder with a 2.95% stake. Additionally, individual investors collectively hold 19.19% of the company's shares. There are currently no holdings by mutual funds or foreign institutional investors.

View full answer

What is the technical trend for Phoenix Intl.?

09-Jun-2025

As of May 3, 2025, Phoenix Intl. exhibits a bearish technical trend, supported by bearish indicators from the MACD, moving averages, and Bollinger Bands, despite a mildly bullish KST on the weekly timeframe.

As of 3 May 2025, the technical trend for Phoenix Intl. has changed from mildly bearish to bearish. The weekly MACD indicates a bearish stance, while the daily moving averages also confirm a bearish outlook. The Bollinger Bands are showing a mildly bearish trend on both weekly and monthly time frames. Although the KST is mildly bullish on the weekly, the overall sentiment remains bearish due to the prevailing indicators. The Dow Theory reflects a mildly bearish trend on the weekly, with no trend on the monthly. Overall, the current technical stance is bearish, with moderate strength driven by the moving averages and MACD.

View full answer

Has Phoenix Intl. declared dividend?

06-Jun-2025

No Dividend History Available

iScoreScore
Click here to find our call on this stock
Strong Sell
Sell
Hold
Buy
Strong Buy

Dashboard

1

Weak Long Term Fundamental Strength with a -0.25% CAGR growth in Operating Profits over the last 5 years

  • Company's ability to service its debt is weak with a poor EBIT to Interest (avg) ratio of 1.54
  • The company has been able to generate a Return on Equity (avg) of 0.57% signifying low profitability per unit of shareholders funds
stock-summaryMojo Parameters

Mojo Parameters

Loading Valuation Snapshot...

Stock DNA

stock-summary
Industry

Diversified Commercial Services

stock-summary
Market cap

INR 53 Cr (Micro Cap)

stock-summary
P/E

19.00

stock-summary
Industry P/E

16

stock-summary
Dividend Yield

0.00%

stock-summary
Debt Equity

0.13

stock-summary
Return on Equity

0.71%

stock-summary
Price to Book

0.15

Revenue and Profits:
Net Sales:
8 Cr
(Quarterly Results - Jun 2026)
Net Profit:
1 Cr
stock-summaryTotal Returns
Total Returns (Price + Dividend) stock-summary
Icon
Company does not have enough history
Risk Adjusted Returns v/s stock-summary
Returns Beta
Icon
Beta has not been calculated since enough price history is not available
stock-summaryKey Factors

Quality key factors stock-summary

Factor
Value
Sales Growth (5y)
5.34%
EBIT Growth (5y)
-0.25%
EBIT to Interest (avg)
1.54
Debt to EBITDA (avg)
5.84
Net Debt to Equity (avg)
0.13
Sales to Capital Employed (avg)
0.06
Tax Ratio
51.06%
Dividend Payout Ratio
0
Pledged Shares
0
Institutional Holding
0
ROCE (avg)
2.34%
ROE (avg)
0.57%

Valuation key factors

Factor
Value
P/E Ratio
19
Industry P/E
16
Price to Book Value
0.15
EV to EBIT
9.32
EV to EBITDA
6.93
EV to Capital Employed
0.24
EV to Sales
3.37
PEG Ratio
0.36
Dividend Yield
NA
ROCE (Latest)
2.60%
ROE (Latest)
0.71%

Technicals key factors

Indicator
Weekly
Monthly
MACD
Mildly Bullish
Bearish
RSI
No Signal
No Signal
Bollinger Bands
Mildly Bullish
Bearish
Moving Averages
Mildly Bearish (Daily)
KST
Mildly Bullish
Bearish
Dow Theory
No Trend
No Trend
OBV
No Trend
No Trend
stock-summary Technical Indicator Scale: Bearish, Mildly Bearish, Sideways, Mildly Bullish, Bullish  Turned 
stock-summaryShareholding
Shareholding Snapshot : Jun 2026stock-summary
Shareholding Compare (%holding) stock-summary
Majority shareholders

Promoters

Pledged Promoter Holdings

None

Mutual Funds

Held by 0 Schemes

FIIs

Held by 0 FIIs

Promoter with highest holding

Vanguard Services Pvt Ltd (18.58%)

Highest Public shareholder

Anil Aggarwal (2.95%)

Individual Investors Holdings

18.73%

stock-summaryFinancial
[
  {
    "link": "quarterly",
    "btn_text": "All Quarterly Results",
    "header": "Quarterly Results Snapshot (Consolidated) - Jun'26 - QoQ",
    "rhs": [
      {
        "prefix": "Net Sales ",
        "suffix": "QoQ Growth in quarter ended Jun 2026 is 2.96% vs 9.91% in Mar 2026",
        "dir": -1
      },
      {
        "prefix": "Consolidated Net Profit ",
        "suffix": "QoQ Growth in quarter ended Jun 2026 is 310.42% vs -328.57% in Mar 2026",
        "dir": 1
      }
    ],
    "table": {
      "header": [
        "Jun'26",
        "Mar'26",
        "Change(%)"
      ],
      "body": [
        {
          "field": "Net Sales",
          "val1": "7.65",
          "val2": "7.43",
          "chgp": "2.96%",
          "chgp_class": "positive"
        },
        {
          "field": "Operating Profit (PBDIT) excl Other Income",
          "val1": "3.50",
          "val2": "3.30",
          "chgp": "6.06%",
          "chgp_class": "positive"
        },
        {
          "field": "Interest",
          "val1": "1.10",
          "val2": "1.34",
          "chgp": "-17.91%",
          "chgp_class": "positive"
        },
        {
          "field": "Exceptional Items",
          "val1": "0.00",
          "val2": "0.00",
          "chgp": "",
          "chgp_class": "neutral"
        },
        {
          "field": "Consolidate Net Profit",
          "val1": "1.01",
          "val2": "-0.48",
          "chgp": "310.42%",
          "chgp_class": "positive"
        },
        {
          "field": "Operating Profit Margin (Excl OI)",
          "val1": "45.75%",
          "val2": "44.41%",
          "chgp": "1.34%",
          "chgp_class": "positive"
        }
      ]
    }
  },
  {
    "link": "half-yearly",
    "btn_text": "All Half Yearly Results",
    "header": "Half Yearly Results Snapshot (Consolidated) - Sep'25",
    "rhs": [
      {
        "prefix": "Net Sales ",
        "suffix": " Growth in half year ended Sep 2025 is 12.78% vs -16.68% in Sep 2024",
        "dir": 1
      },
      {
        "prefix": "Consolidated Net Profit ",
        "suffix": " Growth in half year ended Sep 2025 is 117.19% vs 23.08% in Sep 2024",
        "dir": 1
      }
    ],
    "table": {
      "header": [
        "Sep'25",
        "Sep'24",
        "Change(%)"
      ],
      "body": [
        {
          "field": "Net Sales",
          "val1": "13.41",
          "val2": "11.89",
          "chgp": "12.78%",
          "chgp_class": "positive"
        },
        {
          "field": "Operating Profit (PBDIT) excl Other Income",
          "val1": "7.05",
          "val2": "7.11",
          "chgp": "-0.84%",
          "chgp_class": "negative"
        },
        {
          "field": "Interest",
          "val1": "2.79",
          "val2": "3.49",
          "chgp": "-20.06%",
          "chgp_class": "positive"
        },
        {
          "field": "Exceptional Items",
          "val1": "0.00",
          "val2": "0.00",
          "chgp": "",
          "chgp_class": "neutral"
        },
        {
          "field": "Consolidate Net Profit",
          "val1": "2.78",
          "val2": "1.28",
          "chgp": "117.19%",
          "chgp_class": "positive"
        },
        {
          "field": "Operating Profit Margin (Excl OI)",
          "val1": "52.57%",
          "val2": "59.80%",
          "chgp": "-7.23%",
          "chgp_class": "negative"
        }
      ]
    }
  },
  {
    "link": "nine-monthly",
    "btn_text": "All Nine Monthly Results",
    "header": "Nine Monthly Results Snapshot (Consolidated) - Dec'25",
    "rhs": [
      {
        "prefix": "Net Sales ",
        "suffix": "YoY Growth in nine months ended Dec 2025 is 12.74% vs -13.87% in Dec 2024",
        "dir": 1
      },
      {
        "prefix": "Consolidated Net Profit ",
        "suffix": "YoY Growth in nine months ended Dec 2025 is 48.02% vs 42.25% in Dec 2024",
        "dir": 1
      }
    ],
    "table": {
      "header": [
        "Dec'25",
        "Dec'24",
        "Change(%)"
      ],
      "body": [
        {
          "field": "Net Sales",
          "val1": "20.17",
          "val2": "17.89",
          "chgp": "12.74%",
          "chgp_class": "positive"
        },
        {
          "field": "Operating Profit (PBDIT) excl Other Income",
          "val1": "10.73",
          "val2": "10.35",
          "chgp": "3.67%",
          "chgp_class": "positive"
        },
        {
          "field": "Interest",
          "val1": "4.08",
          "val2": "4.99",
          "chgp": "-18.24%",
          "chgp_class": "positive"
        },
        {
          "field": "Exceptional Items",
          "val1": "0.00",
          "val2": "0.00",
          "chgp": "",
          "chgp_class": "neutral"
        },
        {
          "field": "Consolidate Net Profit",
          "val1": "2.99",
          "val2": "2.02",
          "chgp": "48.02%",
          "chgp_class": "positive"
        },
        {
          "field": "Operating Profit Margin (Excl OI)",
          "val1": "53.20%",
          "val2": "57.85%",
          "chgp": "-4.65%",
          "chgp_class": "negative"
        }
      ]
    }
  },
  {
    "link": "annual",
    "btn_text": "All Annual Results",
    "header": "Annual Results Snapshot (Consolidated) - Mar'26",
    "rhs": [
      {
        "prefix": "Net Sales ",
        "suffix": "YoY Growth in year ended Mar 2026 is 14.77% vs -12.42% in Mar 2025",
        "dir": 1
      },
      {
        "prefix": "Consolidated Net Profit ",
        "suffix": "YoY Growth in year ended Mar 2026 is 59.24% vs -34.03% in Mar 2025",
        "dir": 1
      }
    ],
    "table": {
      "header": [
        "Mar'26",
        "Mar'25",
        "Change(%)"
      ],
      "body": [
        {
          "field": "Net Sales",
          "val1": "27.59",
          "val2": "24.04",
          "chgp": "14.77%",
          "chgp_class": "positive"
        },
        {
          "field": "Operating Profit (PBDIT) excl Other Income",
          "val1": "14.01",
          "val2": "13.53",
          "chgp": "3.55%",
          "chgp_class": "positive"
        },
        {
          "field": "Interest",
          "val1": "5.41",
          "val2": "6.60",
          "chgp": "-18.03%",
          "chgp_class": "positive"
        },
        {
          "field": "Exceptional Items",
          "val1": "0.00",
          "val2": "0.00",
          "chgp": "",
          "chgp_class": "neutral"
        },
        {
          "field": "Consolidate Net Profit",
          "val1": "2.50",
          "val2": "1.57",
          "chgp": "59.24%",
          "chgp_class": "positive"
        },
        {
          "field": "Operating Profit Margin (Excl OI)",
          "val1": "50.78%",
          "val2": "56.28%",
          "chgp": "-5.50%",
          "chgp_class": "negative"
        }
      ]
    }
  }
]

Quarterly Results Snapshot (Consolidated) - Jun'26 - QoQstock-summary

Jun'26
Mar'26
Change(%)
Net Sales
7.65
7.43
2.96%
Operating Profit (PBDIT) excl Other Income
3.50
3.30
6.06%
Interest
1.10
1.34
-17.91%
Exceptional Items
0.00
0.00
Consolidate Net Profit
1.01
-0.48
310.42%
Operating Profit Margin (Excl OI)
45.75%
44.41%
1.34%
Values in Rs Cr.
Direction Arrows
Net Sales

QoQ Growth in quarter ended Jun 2026 is 2.96% vs 9.91% in Mar 2026

Direction Arrows
Consolidated Net Profit

QoQ Growth in quarter ended Jun 2026 is 310.42% vs -328.57% in Mar 2026

Half Yearly Results Snapshot (Consolidated) - Sep'25stock-summary

Sep'25
Sep'24
Change(%)
Net Sales
13.41
11.89
12.78%
Operating Profit (PBDIT) excl Other Income
7.05
7.11
-0.84%
Interest
2.79
3.49
-20.06%
Exceptional Items
0.00
0.00
Consolidate Net Profit
2.78
1.28
117.19%
Operating Profit Margin (Excl OI)
52.57%
59.80%
-7.23%
Values in Rs Cr.
Direction Arrows
Net Sales

Growth in half year ended Sep 2025 is 12.78% vs -16.68% in Sep 2024

Direction Arrows
Consolidated Net Profit

Growth in half year ended Sep 2025 is 117.19% vs 23.08% in Sep 2024

Nine Monthly Results Snapshot (Consolidated) - Dec'25stock-summary

Dec'25
Dec'24
Change(%)
Net Sales
20.17
17.89
12.74%
Operating Profit (PBDIT) excl Other Income
10.73
10.35
3.67%
Interest
4.08
4.99
-18.24%
Exceptional Items
0.00
0.00
Consolidate Net Profit
2.99
2.02
48.02%
Operating Profit Margin (Excl OI)
53.20%
57.85%
-4.65%
Values in Rs Cr.
Direction Arrows
Net Sales

YoY Growth in nine months ended Dec 2025 is 12.74% vs -13.87% in Dec 2024

Direction Arrows
Consolidated Net Profit

YoY Growth in nine months ended Dec 2025 is 48.02% vs 42.25% in Dec 2024

Annual Results Snapshot (Consolidated) - Mar'26stock-summary

Mar'26
Mar'25
Change(%)
Net Sales
27.59
24.04
14.77%
Operating Profit (PBDIT) excl Other Income
14.01
13.53
3.55%
Interest
5.41
6.60
-18.03%
Exceptional Items
0.00
0.00
Consolidate Net Profit
2.50
1.57
59.24%
Operating Profit Margin (Excl OI)
50.78%
56.28%
-5.50%
Values in Rs Cr.
Direction Arrows
Net Sales

YoY Growth in year ended Mar 2026 is 14.77% vs -12.42% in Mar 2025

Direction Arrows
Consolidated Net Profit

YoY Growth in year ended Mar 2026 is 59.24% vs -34.03% in Mar 2025

stock-summaryCompany CV
About Phoenix International Ltd stock-summary
stock-summary
Phoenix International Ltd
Micro Cap
Diversified Commercial Services
Incorporated as a private limited company in Dec.'87, Phoenix International (PIL) was converted into a public limited company in Jun.'88. It was promoted by D N Kalsi and Ajay Kalsi. PIL came out with a public issue in Apr.'94 to part-finance the setting up of manufacturing facilities for 8,40,000 pairs of synthetic footwear (sport shoes) at Ghaziabad. The Company is in the business of leasing out buildings and is a manufacturer and supplier of Shoe Uppers in Chennai, India.
Company Coordinates stock-summary
Company Details
3rd Floor Gopala Tower, 25 Rajendra Place New Delhi New Delhi : 110008
stock-summary
Tel:
stock-summary
gopala@phoenixindia.com
Registrar Details
MAS Services Ltd, T-34 , 2nd Floor, Okhla Industrial Area, Phase - II, New Delhi