
Compare Blue Chip India with Similar Stocks
Stock DNA
Non Banking Financial Company (NBFC)
INR 10 Cr (Micro Cap)
NA (Loss Making)
21
0.00%
0.00
27.00%
-10.23
Total Returns (Price + Dividend) 
Blue Chip India for the last several years.
Risk Adjusted Returns v/s
Returns Beta

News
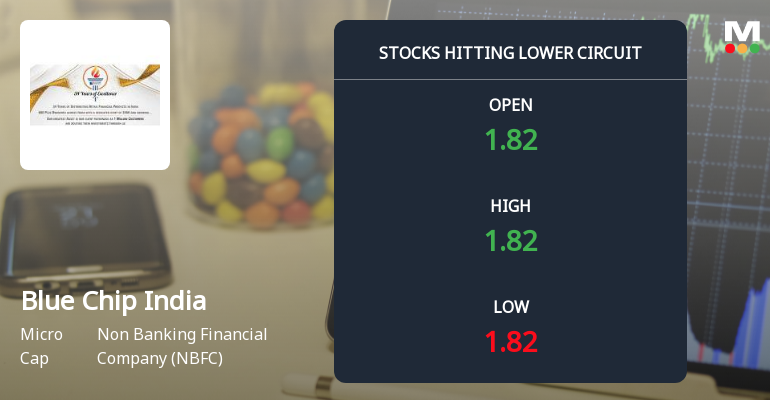
Below All Moving Averages and Now at Lower Circuit: Blue Chip India Ltd Loses 1.62% in a Single Session
At Rs 1.82, Blue Chip India Ltd locked at its lower circuit on 29 Jul 2026, marking a 1.62% decline within a narrow 2% price band. Sellers queued persistently with no buyers stepping in, resulting in unfilled supply and a frozen price that underscores the stock’s fragile liquidity position.
Read full news article
Below All Moving Averages and Now at Lower Circuit: Blue Chip India Ltd Loses 1.6% in a Single Session
At Rs 1.85, sellers were still queuing — but there were no buyers willing to take the other side. Blue Chip India Ltd locked at its lower circuit of 2% on 28 Jul 2026, with unfilled sell orders and a frozen price, signalling persistent selling pressure in a micro-cap stock with limited liquidity.
Read full news article
Below All Moving Averages and Now at Lower Circuit: Blue Chip India Ltd Loses 1.57% in a Single Session
At Rs 1.88, sellers were still queuing — but there were no buyers willing to take the other side. Blue Chip India Ltd locked at its lower circuit of 2% on 27 Jul 2026, with unfilled sell orders and a frozen price, signalling persistent selling pressure in a micro-cap stock with limited liquidity.
Read full news article Announcements
Blue Chip India Limited - Press Release
18-Nov-2019 | Source : NSEBlue Chip India Limited has informed the Exchange regarding a press release dated November 16, 2019, titled "Bluechip newspaper publication for unaudited financial result for the quarter ended 30.09.2019 ".
Blue Chip India Limited - Outcome of Board Meeting
15-Nov-2019 | Source : NSEBlue Chip India Limited has informed the Exchange regarding Board meeting held on November 14, 2019.
Blue Chip India Limited - Press Release
05-Nov-2019 | Source : NSEBlue Chip India Limited has informed the Exchange regarding a press release dated November 02, 2019, titled "Board Meeting Newspaper Publication for the Quarter ended 30.09.2019".
Corporate Actions

No Upcoming Board Meetings

No Dividend history available

No Splits history available

No Bonus history available

No Rights history available
Quality key factors
Valuation key factors
Technicals key factors
 Technical Indicator Scale: Bearish, Mildly Bearish, Sideways, Mildly Bullish, Bullish Turned
 Shareholding Snapshot : Jun 2026
Shareholding Compare (%holding)
Non Institution
None
Held by 0 Schemes
Held by 0 FIIs
Bahubali Properties Limited (7.2%)
Future Zone Entertainment Pvt Ltd (4.47%)
65.8%
Quarterly Results Snapshot (Standalone) - Mar'26 - YoY
YoY Growth in quarter ended Mar 2026 is 0.00% vs 0.00% in Mar 2025

YoY Growth in quarter ended Mar 2026 is 103.57% vs 0.00% in Mar 2025
Half Yearly Results Snapshot (Standalone) - Sep'25
Growth in half year ended Sep 2025 is 0.00% vs 0.00% in Sep 2024

Growth in half year ended Sep 2025 is -333.33% vs 97.97% in Sep 2024
Nine Monthly Results Snapshot (Standalone) - Dec'25
YoY Growth in nine months ended Dec 2025 is 0.00% vs 0.00% in Dec 2024
YoY Growth in nine months ended Dec 2025 is -300.00% vs 96.94% in Dec 2024
Annual Results Snapshot (Standalone) - Mar'26
YoY Growth in year ended Mar 2026 is 200.00% vs 0.00% in Mar 2025
YoY Growth in year ended Mar 2026 is 89.27% vs 11.22% in Mar 2025
About Blue Chip India Ltd

Company Coordinates


