
Compare Hexa Tradex with Similar Stocks
Dashboard
Poor long term growth as Operating profit has grown by an annual rate -186.30% of over the last 5 years
Flat results in Mar 26
Risky - Negative EBITDA
Despite the size of the company, domestic mutual funds hold only 0.1% of the company
Below par performance in long term as well as near term
Stock DNA
Non Banking Financial Company (NBFC)
INR 889 Cr (Micro Cap)
NA (Loss Making)
23
0.00%
0.00
-0.27%
0.20
Total Returns (Price + Dividend) 
Hexa Tradex for the last several years.
Risk Adjusted Returns v/s
Returns Beta

News
Hexa Tradex Ltd Upgraded to Sell on Technical Improvement Despite Financial Challenges
Hexa Tradex Ltd, a micro-cap player in the Non Banking Financial Company (NBFC) sector, has seen its investment rating upgraded from Strong Sell to Sell as of 21 July 2026. This change reflects a nuanced shift in the company’s technical outlook despite persistent challenges in its financial performance and valuation metrics.
Read full news article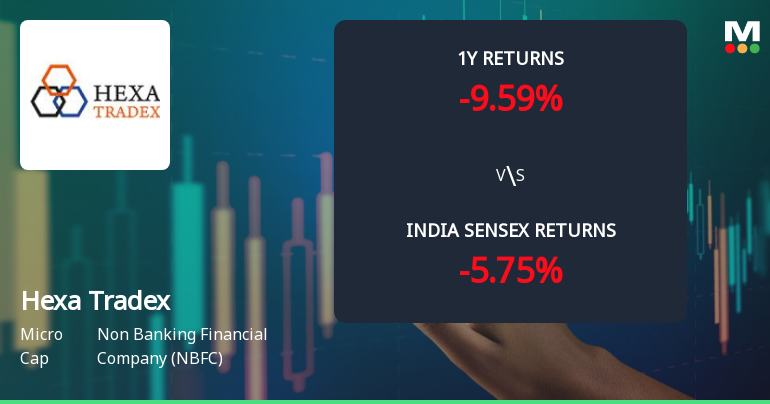
Hexa Tradex Ltd Sees Technical Momentum Shift Amid Mixed Indicator Signals
Hexa Tradex Ltd, a micro-cap player in the Non Banking Financial Company (NBFC) sector, has exhibited a subtle shift in its technical momentum, moving from a bearish to a mildly bearish trend. Despite a notable 5.7% surge in the stock price on 22 Jul 2026, technical indicators present a complex picture, with some signalling cautious optimism while others remain subdued, reflecting the nuanced market sentiment surrounding this NBFC.
Read full news article
Hexa Tradex Ltd is Rated Strong Sell
Hexa Tradex Ltd is rated Strong Sell by MarketsMOJO, with this rating last updated on 29 June 2026. However, the analysis and financial metrics presented here reflect the stock's current position as of 11 July 2026, providing investors with the latest insights into the company’s performance and outlook.
Read full news article Announcements
Hexa Tradex Limited - Clarification
26-Nov-2019 | Source : NSEHexa Tradex Limited with respect to announcement dated 22-Nov-2019, regarding Board meeting held on November 22, 2019. On basis of above the Company is required to clarify following: 1. Disclosure of relationships between directors (in case of appointment of a director)
Hexa Tradex Limited - Shareholders meeting
26-Sep-2019 | Source : NSEHexa Tradex Limited has informed the Exchange with copy of minutes of Annual General Meeting held on September 09, 2019
Shareholders meeting
11-Sep-2019 | Source : NSE
| Hexa Tradex Limited has submitted the Exchange a copy Srutinizers report of Annual General Meeting held on September 09, 2019. Further, the company has informed the Exchange regarding voting results. |
Corporate Actions

No Upcoming Board Meetings

No Dividend history available

No Splits history available

No Bonus history available

No Rights history available
Quality key factors
Valuation key factors
Technicals key factors
 Technical Indicator Scale: Bearish, Mildly Bearish, Sideways, Mildly Bullish, Bullish Turned
 Shareholding Snapshot : Mar 2026
Shareholding Compare (%holding)
Promoters
None
Held by 5 Schemes (0.01%)
Held by 9 FIIs (0.04%)
Nalwa Sons Investments Limited (19.39%)
Anil Kantiprasad Poddar (2.26%)
6.49%
Quarterly Results Snapshot (Consolidated) - Mar'26 - QoQ

QoQ Growth in quarter ended Mar 2026 is 7,150.00% vs -99.36% in Dec 2025
QoQ Growth in quarter ended Mar 2026 is 23.68% vs -388.76% in Dec 2025
Half Yearly Results Snapshot (Consolidated) - Sep'25
Growth in half year ended Sep 2025 is 1.63% vs -96.83% in Sep 2024
Growth in half year ended Sep 2025 is 97.79% vs -173.70% in Sep 2024
Nine Monthly Results Snapshot (Consolidated) - Dec'25
YoY Growth in nine months ended Dec 2025 is 2.29% vs -97.76% in Dec 2024
YoY Growth in nine months ended Dec 2025 is 74.59% vs -122.66% in Dec 2024
Annual Results Snapshot (Consolidated) - Mar'26
YoY Growth in year ended Mar 2026 is 0.44% vs -96.58% in Mar 2025
YoY Growth in year ended Mar 2026 is 65.05% vs -127.03% in Mar 2025
About Hexa Tradex Ltd

Company Coordinates


