
Compare Jayant Agro Org. with Similar Stocks
Dashboard
Strong ability to service debt as the company has a low Debt to EBITDA ratio of 1.26 times
Poor long term growth as Operating profit has grown by an annual rate -0.37% of over the last 5 years
The company has declared positive results in Mar'2026 after 2 consecutive negative quarters
With ROCE of 11.3, it has a Very Attractive valuation with a 1 Enterprise value to Capital Employed
Despite the size of the company, domestic mutual funds hold only 0% of the company
Stock DNA
Specialty Chemicals
INR 609 Cr (Micro Cap)
12.00
45
0.00%
0.19
8.26%
0.99
Total Returns (Price + Dividend) 
Latest dividend: 2.5 per share ex-dividend date: Jun-27-2025
Risk Adjusted Returns v/s
Returns Beta

News
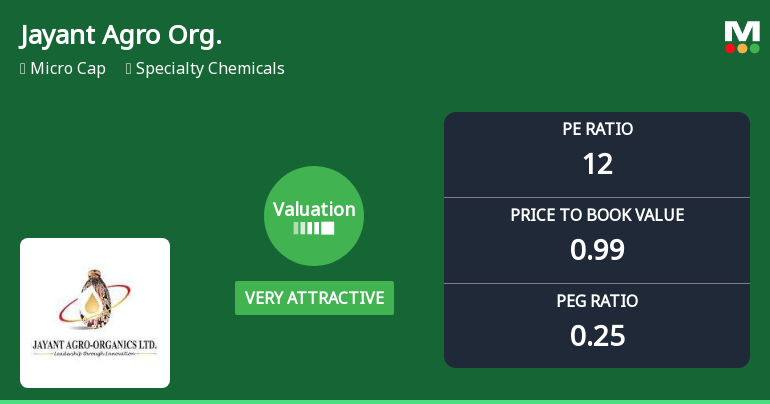
Jayant Agro Organics Ltd Valuation Shifts to Very Attractive Amid Market Challenges
Jayant Agro Organics Ltd has witnessed a significant shift in its valuation parameters, moving from an attractive to a very attractive price range, driven by favourable changes in its price-to-earnings and price-to-book ratios. This re-rating comes amid a challenging market backdrop and evolving investor sentiment within the specialty chemicals sector.
Read full news article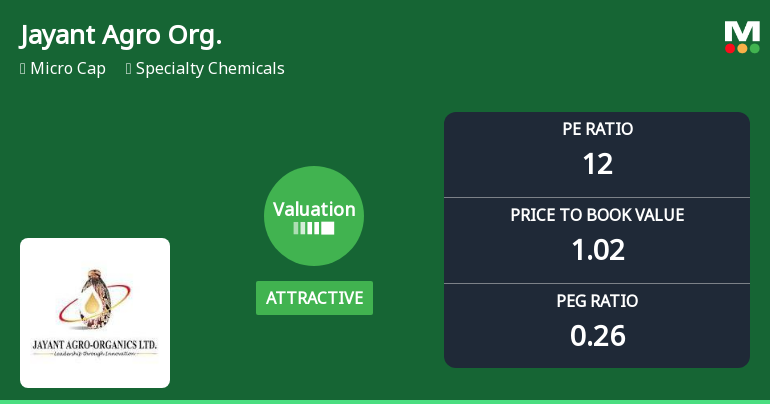
Jayant Agro Organics Ltd Valuation Shifts Signal Renewed Price Attractiveness
Jayant Agro Organics Ltd has witnessed a notable improvement in its valuation parameters, shifting from a very attractive to an attractive rating, signalling a positive change in price attractiveness for investors within the specialty chemicals sector. This upgrade accompanies a recent Mojo Grade improvement from Sell to Hold, reflecting evolving market perceptions and fundamental reassessments.
Read full news article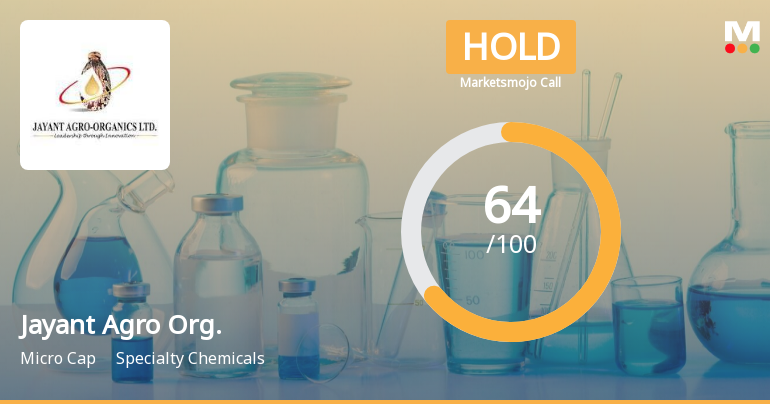
Jayant Agro Organics Ltd is Rated Hold
Jayant Agro Organics Ltd is rated 'Hold' by MarketsMOJO, with this rating last updated on 15 June 2026. However, the analysis and financial metrics discussed here reflect the company’s current position as of 27 June 2026, providing investors with an up-to-date perspective on the stock’s fundamentals, valuation, financial trends, and technical outlook.
Read full news article Announcements
Jayant Agro Organics Limited - Other General Purpose
15-Nov-2019 | Source : NSEJayant Agro Organics Limited has informed the Exchange regarding Certificate in terms of Regulation 23(9) of the Securities and Exchange Board of India (Listing Obligations and Disclosure Requirements) Regulations, 2015, for the half year ended September 30, 2019.
Jayant Agro Organics Limited - Outcome of Board Meeting
25-Oct-2019 | Source : NSEJayant Agro Organics Limited has informed the Exchange regarding Board meeting held on October 24, 2019.
Updates
04-Sep-2019 | Source : NSE
| Jayant Agro Organics Limited has informed the Exchange regarding 'Newspaper Advertisement'. |
Corporate Actions

No Upcoming Board Meetings

Jayant Agro Organics Ltd has declared 50% dividend, ex-date: 27 Jun 25

No Splits history available

Jayant Agro Organics Ltd has announced 1:1 bonus issue, ex-date: 01 Aug 17

No Rights history available
Quality key factors
Valuation key factors
Technicals key factors
 Technical Indicator Scale: Bearish, Mildly Bearish, Sideways, Mildly Bullish, Bullish Turned
 Shareholding Snapshot : Mar 2026
Shareholding Compare (%holding)
Promoters
None
Held by 0 Schemes
Held by 2 FIIs (0.04%)
Hitesh Jayraj Udeshi (7.54%)
Itoh Oil Chemicals Co Ltd. (4%)
22.36%
Quarterly Results Snapshot (Consolidated) - Mar'26 - QoQ

QoQ Growth in quarter ended Mar 2026 is 10.11% vs 17.55% in Dec 2025

QoQ Growth in quarter ended Mar 2026 is 155.12% vs -28.19% in Dec 2025
Half Yearly Results Snapshot (Consolidated) - Sep'25
Growth in half year ended Sep 2025 is -10.85% vs 20.02% in Sep 2024
Growth in half year ended Sep 2025 is -11.83% vs 10.71% in Sep 2024
Nine Monthly Results Snapshot (Consolidated) - Dec'25
YoY Growth in nine months ended Dec 2025 is -7.13% vs 24.29% in Dec 2024
YoY Growth in nine months ended Dec 2025 is -24.64% vs 20.91% in Dec 2024
Annual Results Snapshot (Consolidated) - Mar'26
YoY Growth in year ended Mar 2026 is -4.84% vs 17.59% in Mar 2025
YoY Growth in year ended Mar 2026 is -8.20% vs 6.95% in Mar 2025
About Jayant Agro Organics Ltd

Company Coordinates


