
Compare GRP with Similar Stocks
Dashboard
Low ability to service debt as the company has a high Debt to EBITDA ratio of 5.16 times
- Poor long term growth as Net Sales has grown by an annual rate of 11.41% over the last 5 years
- Low ability to service debt as the company has a high Debt to EBITDA ratio of 5.16 times
- The company has been able to generate a Return on Equity (avg) of 9.36% signifying low profitability per unit of shareholders funds
Poor long term growth as Net Sales has grown by an annual rate of 11.41% over the last 5 years
Flat results in Jun 26
With ROCE of 5.8, it has a Expensive valuation with a 3.3 Enterprise value to Capital Employed
Despite the size of the company, domestic mutual funds hold only 0% of the company
Stock DNA
Industrial Products
INR 1,067 Cr (Micro Cap)
154.00
87
0.18%
1.08
2.43%
5.85
Total Returns (Price + Dividend) 
Latest dividend: 3.5 per share ex-dividend date: Jul-16-2026
Risk Adjusted Returns v/s
Returns Beta

News
GRP Ltd is Rated Sell
GRP Ltd is rated 'Sell' by MarketsMOJO, with this rating last updated on 23 July 2026. However, the analysis and financial metrics discussed here reflect the stock's current position as of 30 July 2026, providing investors with an up-to-date view of the company’s fundamentals, valuation, financial trends, and technical outlook.
Read full news articleAre GRP Ltd latest results good or bad?
GRP Ltd's latest financial results for Q1 FY27 present a complex picture. The company reported a net profit of ₹4.20 crores, reflecting a significant year-on-year increase of 140%. Revenue also demonstrated strong growth, with a 26.73% rise compared to the same quarter last year, amounting to ₹156.83 crores. This revenue growth was accompanied by an operating margin of 10.78%, the highest in the last eight quarters, indicating improved operational efficiency. However, these quarterly gains must be contextualized against a challenging annual backdrop. For FY26, GRP experienced a revenue decline of 2.70%, with net profit plummeting 90% from ₹30.00 crores in FY25 to just ₹3.00 crores. This stark contrast highlights ongoing structural challenges within the company. The volatility in operating margins, which fluctuated significantly over the past few quarters, raises concerns about the sustainability of the rec...
Read full news article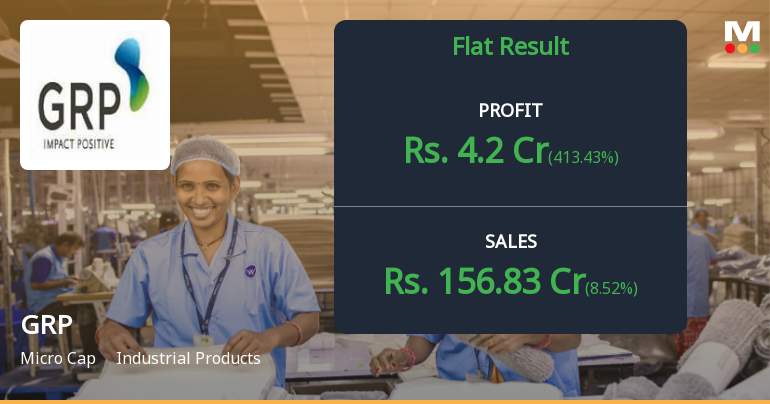
GRP Ltd Q1 FY27: Profit Surge Masks Underlying Margin Pressures and Valuation Concerns
GRP Ltd., a Gujarat-based reclaim rubber manufacturer, reported a sharp turnaround in Q1 FY27 with net profit of ₹4.20 crores, reversing the previous quarter's loss of ₹1.34 crores. The 140.00% year-on-year profit growth and 26.73% revenue expansion to ₹156.83 crores initially appear encouraging, yet the stock's muted response—trading at ₹2,018.70 with a modest 3.38% gain—reflects deeper investor concerns about sustainability and valuation.
Read full news article Announcements
GRP Limited - Updates
18-Nov-2019 | Source : NSEGRP Limited has informed the Exchange regarding 'Newspaper publication for transfer of shares to the Investor Education and Protection Fund account'.
GRP Limited - Investor Presentation
14-Nov-2019 | Source : NSEGRP Limited has informed the Exchange regarding Investor Presentation
GRP Limited - Analysts/Institutional Investor Meet/Con. Call Updates
17-Oct-2019 | Source : NSEGRP Limited has informed the Exchange regarding Analysts/Institutional Investor Meet/Con. Call Updates
Corporate Actions

No Upcoming Board Meetings

GRP Ltd has declared 35% dividend, ex-date: 16 Jul 26

No Splits history available

GRP Ltd has announced 3:1 bonus issue, ex-date: 12 Aug 24

No Rights history available
Quality key factors
Valuation key factors
Technicals key factors
 Technical Indicator Scale: Bearish, Mildly Bearish, Sideways, Mildly Bullish, Bullish Turned
 Shareholding Snapshot : Jun 2026
Shareholding Compare (%holding)
Non Institution
None
Held by 1 Schemes (0.0%)
Held by 4 FIIs (0.02%)
Rajendra Vadilal Gandhi (4.87%)
Meera Philip (6.12%)
44.13%
Quarterly Results Snapshot (Consolidated) - Jun'26 - QoQ

QoQ Growth in quarter ended Jun 2026 is 8.52% vs 7.28% in Mar 2026
QoQ Growth in quarter ended Jun 2026 is 413.43% vs -257.65% in Mar 2026
Half Yearly Results Snapshot (Consolidated) - Sep'25

Growth in half year ended Sep 2025 is -0.68% vs 20.63% in Sep 2024
Growth in half year ended Sep 2025 is -46.00% vs 3.31% in Sep 2024
Nine Monthly Results Snapshot (Consolidated) - Dec'25
YoY Growth in nine months ended Dec 2025 is 0.18% vs 20.61% in Dec 2024
YoY Growth in nine months ended Dec 2025 is -59.47% vs 2.65% in Dec 2024
Annual Results Snapshot (Consolidated) - Mar'26
YoY Growth in year ended Mar 2026 is -2.75% vs 19.31% in Mar 2025
YoY Growth in year ended Mar 2026 is -89.51% vs 35.60% in Mar 2025
About GRP Ltd

Company Coordinates


