
Compare National Standar with Similar Stocks
Dashboard
Poor Management Efficiency with a low ROE of 6.15%
- The company has been able to generate a Return on Equity (avg) of 6.15% signifying low profitability per unit of shareholders funds
Poor long term growth as Operating profit has grown by an annual rate -233.98% of over the last 5 years
Negative results in Mar 26
Risky - Negative EBITDA
Despite the size of the company, domestic mutual funds hold only 0% of the company
Total Returns (Price + Dividend) 

Risk Adjusted Returns v/s
Returns Beta
News

National Standard (India) Ltd is Rated Strong Sell
National Standard (India) Ltd is rated Strong Sell by MarketsMOJO. This rating was last updated on 17 Apr 2026. However, the analysis and financial metrics discussed below reflect the stock’s current position as of 09 May 2026, providing investors with an up-to-date view of the company’s performance and outlook.
Read full news article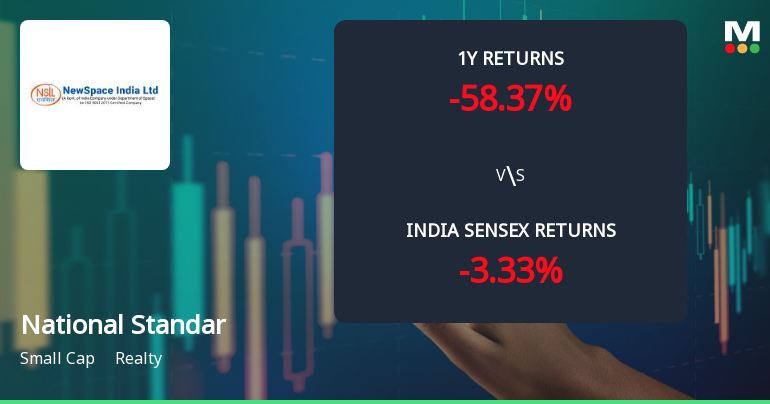
National Standard (India) Ltd Shows Mixed Technical Signals Amid Mild Momentum Shift
National Standard (India) Ltd, a small-cap player in the realty sector, has experienced a nuanced shift in its technical momentum, reflecting a complex interplay of bullish and bearish indicators. Despite a modest day change of 0.22%, the stock’s technical parameters reveal a transition from a bearish to a mildly bearish trend, signalling cautious optimism amid persistent challenges.
Read full news article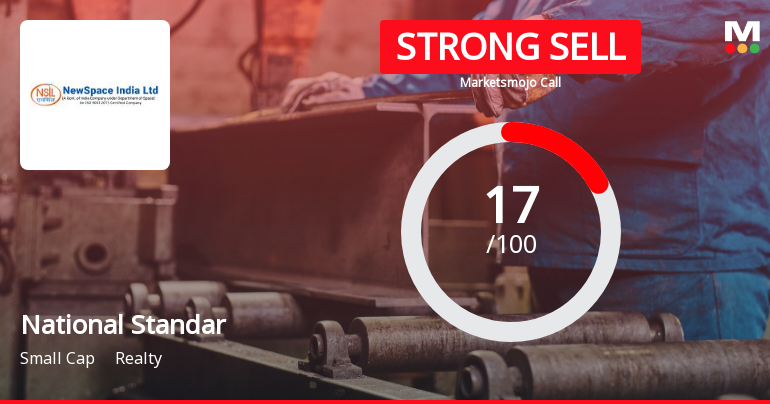
National Standard (India) Ltd is Rated Strong Sell
National Standard (India) Ltd is rated Strong Sell by MarketsMOJO. This rating was last updated on 17 April 2026. However, the analysis and financial metrics discussed here reflect the stock's current position as of 28 April 2026, providing investors with the latest insights into the company’s performance and outlook.
Read full news article Announcements
Corporate Actions

No Upcoming Board Meetings

No Dividend history available

No Splits history available

No Bonus history available

No Rights history available
Quality key factors
Valuation key factors
Technicals key factors
 Technical Indicator Scale: Bearish, Mildly Bearish, Sideways, Mildly Bullish, Bullish Turned
 Shareholding Snapshot : Mar 2026
Shareholding Compare (%holding)
Promoters
None
Held by 0 Schemes
Held by 0 FIIs
Lodha Developers Limited (73.94%)
Gurpreet Kaur Shinh (6.8%)
21.11%
Quarterly Results Snapshot (Standalone) - Mar'26 - QoQ

QoQ Growth in quarter ended Mar 2026 is -100.00% vs -81.62% in Dec 2025
QoQ Growth in quarter ended Mar 2026 is -64.31% vs -23.71% in Dec 2025
Half Yearly Results Snapshot (Standalone) - Sep'25

Growth in half year ended Sep 2025 is 350.39% vs 294.85% in Sep 2024
Growth in half year ended Sep 2025 is -29.66% vs 33.04% in Sep 2024
Nine Monthly Results Snapshot (Standalone) - Dec'25
YoY Growth in nine months ended Dec 2025 is 4.61% vs 23.62% in Dec 2024
YoY Growth in nine months ended Dec 2025 is -11.56% vs -8.75% in Dec 2024
Annual Results Snapshot (Standalone) - Mar'26
YoY Growth in year ended Mar 2026 is -8.55% vs 4.49% in Mar 2025
YoY Growth in year ended Mar 2026 is -26.82% vs -10.45% in Mar 2025
About National Standard (India) Ltd

Company Coordinates


