
Compare Ginni Filaments with Similar Stocks
Dashboard
Weak Long Term Fundamental Strength with a -7.98% CAGR growth in Operating Profits over the last 5 years
- Low ability to service debt as the company has a high Debt to EBITDA ratio of 0.61 times
- The company has been able to generate a Return on Equity (avg) of 8.59% signifying low profitability per unit of shareholders funds
- PAT(Q) At Rs 7.18 cr has Fallen at -48.1%
- PBDIT(Q) Lowest at Rs 13.25 cr.
- OPERATING PROFIT TO NET SALES (Q) Lowest at 14.71%
Stock DNA
Garments & Apparels
INR 389 Cr (Micro Cap)
8.00
23
0.00%
0.07
19.73%
1.66
Total Returns (Price + Dividend) 
Latest dividend: 0.4200 per share ex-dividend date: Mar-21-2007
Risk Adjusted Returns v/s
Returns Beta

News
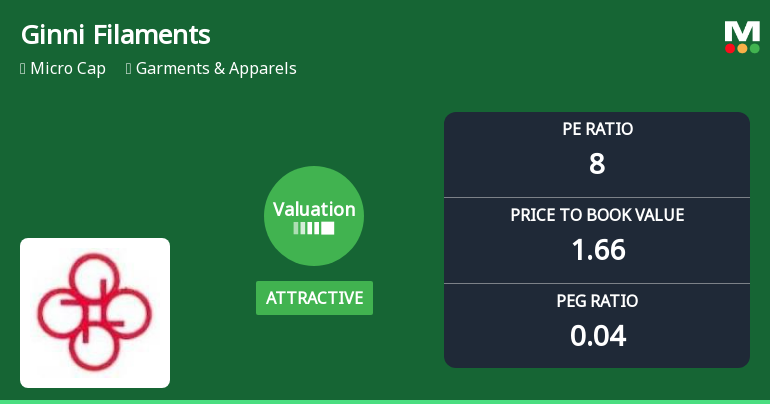
Ginni Filaments Ltd Valuation Shifts Signal Attractive Entry Amid Strong Market Returns
Ginni Filaments Ltd has witnessed a notable shift in its valuation parameters, moving from fair to attractive territory, driven by a compelling price-to-earnings (P/E) ratio of 8.43 and a price-to-book value (P/BV) of 1.66. This re-rating comes amid robust financial metrics and impressive stock performance that outpaces the broader market, positioning the micro-cap garment and apparel company as a potential value opportunity for discerning investors.
Read full news articleAre Ginni Filaments Ltd latest results good or bad?
Ginni Filaments Ltd's latest financial results for the quarter ended March 2026 reveal a complex operational landscape characterized by contrasting trends in revenue and profitability. The company reported net sales of ₹90.10 crores, reflecting a sequential growth of 9.85% from the previous quarter, although year-on-year growth was marginal at just 0.11%. This indicates a stagnation in demand conditions within the textile sector. In terms of profitability, Ginni Filaments experienced a decline in net profit, which fell to ₹7.16 crores, marking a quarter-on-quarter decrease of 20.68% and a year-on-year drop of 28.11%. The operating margin also contracted significantly to 14.71%, down from 17.82% in the previous quarter, highlighting challenges in maintaining profitability amidst rising input costs and competitive pressures. The company's operational metrics indicate that while it has managed to achieve rev...
Read full news article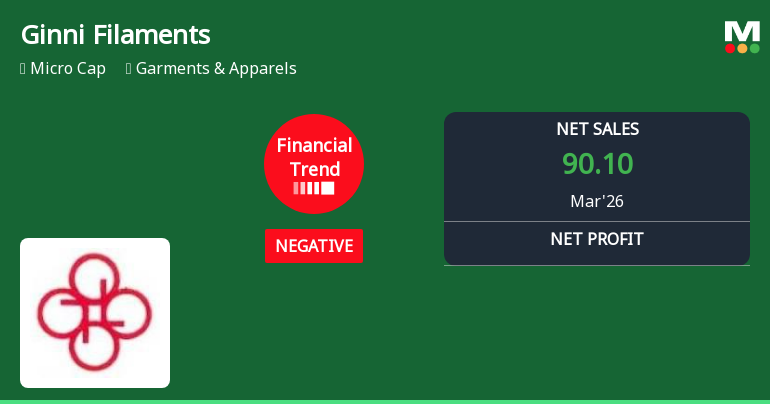
Ginni Filaments Ltd Reports Sharp Quarterly Decline Amid Negative Financial Trend
Ginni Filaments Ltd, a micro-cap player in the Garments & Apparels sector, has reported a notable decline in its financial performance for the quarter ended March 2026, signalling a shift from its previously positive trajectory. Despite a robust nine-month profit growth, the latest quarter’s results reveal contraction in key profitability metrics, prompting a downgrade in its Mojo Grade to Strong Sell.
Read full news article Announcements
Ginni Filaments Limited - Other General Purpose
13-Nov-2019 | Source : NSEGinni Filaments Limited has informed the Exchange regarding disclosure of Related Party Transaction on a consolidated basis for the half year ended on September 30, 2019.
Ginni Filaments Limited - Updates
17-Oct-2019 | Source : NSEGinni Filaments Limited has informed the Exchange regarding ''.
Shareholders meeting
07-Sep-2019 | Source : NSE
| Ginni Filaments Limited has informed the Exchange regarding Proceedings of Annual General Meeting held on September 07, 2019. Further, the company has submitted the Exchange a copy of Srutinizers report along with voting results. |
Corporate Actions

No Upcoming Board Meetings

Ginni Filaments Ltd has declared 5% dividend, ex-date: 21 Mar 07

No Splits history available

No Bonus history available

No Rights history available
Quality key factors
Valuation key factors
Technicals key factors
 Technical Indicator Scale: Bearish, Mildly Bearish, Sideways, Mildly Bullish, Bullish Turned
 Shareholding Snapshot : Mar 2026
Shareholding Compare (%holding)
Promoters
17.4293
Held by 1 Schemes (0.0%)
Held by 1 FIIs (0.17%)
Raghukul Trading Private Limited (23.36%)
Zaki Abbas Nasser (1.73%)
25.85%
Quarterly Results Snapshot (Standalone) - Mar'26 - YoY

YoY Growth in quarter ended Mar 2026 is 0.11% vs -7.99% in Mar 2025

YoY Growth in quarter ended Mar 2026 is 48.85% vs 109.43% in Mar 2025
Half Yearly Results Snapshot (Standalone) - Sep'25
Growth in half year ended Sep 2025 is 14.93% vs 2.86% in Sep 2024
Growth in half year ended Sep 2025 is 20,770.00% vs 100.51% in Sep 2024
Nine Monthly Results Snapshot (Standalone) - Dec'25
YoY Growth in nine months ended Dec 2025 is 13.15% vs -2.70% in Dec 2024
YoY Growth in nine months ended Dec 2025 is 5,169.49% vs 98.25% in Dec 2024
Annual Results Snapshot (Standalone) - Mar'26
YoY Growth in year ended Mar 2026 is 22.94% vs -14.53% in Mar 2025
YoY Growth in year ended Mar 2026 is 781.90% vs 104.97% in Mar 2025
About Ginni Filaments Ltd

Company Coordinates


