Sharda Motor

  • Market Cap: Small Cap
  • Industry: Auto Components & Equipments
  • ISIN: INE597I01028
  • NSEID: SHARDAMOTR
  • BSEID: 535602
INR
850.00
-3.1 (-0.36%)
BSENSE

May 25

BSE+NSE Vol: 77.4 k

  • Price Points
  • Score
  • Mojo Parameters
  • Total Return
  • News and Corporate Actions
  • Key factors
  • Shareholding
  • Financials
  • CompanyCV
stock-summaryPrice Point
High/Low

1Day

52 Week

Valuation
Technical
Day's Volume

CASH

77.4 k (64.12%) Volume

Shareholding (Mar 2026)

FII

2.43%

Held by 73 FIIs

DII

11.51%

Held by 12 DIIs

Promoter

64.31%

Who are the top shareholders of the Sharda Motor?

06-Jun-2025

The top shareholders of Sharda Motor include promoters, with Ajay Relan holding the largest stake, and institutional investors, with mutual funds owning 10.87% led by ICICI Prudential Flexicap Fund at 4.31%. Individual investors hold 17.49%, while Foreign Institutional Investors (FIIs) account for 2.2%.

The top shareholders of Sharda Motor include a mix of promoters, mutual funds, and individual investors. The majority shareholders are the promoters, with no pledged promoter holdings reported. Among the promoters, Ajay Relan holds the highest stake, although his specific percentage is not detailed.<BR><BR>In terms of institutional investors, six mutual fund schemes collectively hold 10.87% of the company, with the ICICI Prudential Flexicap Fund being the largest public shareholder at 4.31%. Additionally, individual investors hold a significant portion, accounting for 17.49% of the shares. Foreign Institutional Investors (FIIs) also have a presence, holding 2.2% through 67 different FIIs.

View full answer

What does Sharda Motor do?

06-Jun-2025

Sharda Motor Industries Ltd manufactures automotive parts and was incorporated in 1986. As of March 2025, it reported net sales of ₹750 Cr and a net profit of ₹84 Cr, with a market cap of ₹5,725 Cr.

Overview:<BR>Sharda Motor Industries Ltd operates in the Auto Components & Equipments industry, focusing on manufacturing automotive parts.<BR><BR>History:<BR>The company was incorporated on January 29, 1986, under the Companies Act, 1956. It received the Certificate of Commencement of Business on January 31, 1986. The latest quarterly results reported net sales and profit for March 2025.<BR><BR>Financial Snapshot:<BR>Net Sales: 750 Cr (Quarterly Results - Mar 2025) <BR>Net Profit: 84 Cr (Quarterly Results - Mar 2025) <BR>Market Cap: Rs 5,725 Cr (Mid Cap)<BR><BR>Key Metrics:<BR>P/E: 18.00 <BR>Industry P/E: 36 <BR>Dividend Yield: 0.52% <BR>Debt Equity: -0.80 <BR>Return on Equity: 29.66% <BR>Price to Book: 5.33<BR><BR>Contact Details:<BR>Address: D-188 Okhla Industrial Area, Phase-1 New Delhi New Delhi : 110020 <BR>Tel: 91-11-47334100 <BR>Email: smil@shardamotor.com <BR>Website: http://www.shardamotor.com

View full answer

Has Sharda Motor declared dividend?

06-Jun-2025

Yes, Sharda Motor Industries Ltd has declared a dividend of 1625% (₹9.92 per share) with an ex-date of June 13, 2025. The company has shown strong total returns over various periods, particularly over the long term.

Sharda Motor Industries Ltd has declared a dividend.<BR><BR>Dividend Details:<BR>- Percentage announced: 1625%<BR>- Amount per share: 9.92<BR>- Ex-date: 13 Jun 25<BR><BR>Dividend Yield: 0.52%<BR><BR>Total Returns by Period:<BR>In the last 6 months, the price return was -6.75%, the dividend return was 1.56%, resulting in a total return of -5.19%.<BR><BR>Over the past year, the price return was 19.54%, the dividend return was 2.58%, leading to a total return of 22.12%.<BR><BR>In the 2-year period, the price return was 139.11%, the dividend return was 7.39%, culminating in a total return of 146.5%.<BR><BR>For the 3-year period, the price return was 157.38%, the dividend return was 9.49%, which resulted in a total return of 166.87%.<BR><BR>In the last 4 years, the price return was 371.18%, the dividend return was 13.53%, giving a total return of 384.71%.<BR><BR>Over the past 5 years, the price return was 1227.24%, the dividend return was 8.43%, resulting in a total return of 1235.67%.<BR><BR>Overall, Sharda Motor has declared a substantial dividend, and the total returns over various periods indicate strong performance, particularly over the longer term. The significant price appreciation combined with dividend returns reflects a positive investment outlook.

View full answer

Who are the peers of the Sharda Motor?

03-Jun-2025

Sharda Motor's peers include Samvardh. Mothe., Bosch, Schaeffler India, Bharat Forge, Tube Investments, Lumax Auto Tech., Pricol Ltd, Sundaram Clayton, Subros, and Rolex Rings. In terms of management risk, growth, and capital structure, Sharda Motor ranks well among its peers, with a 1-year return of 19.67%.

Peers: The peers of Sharda Motor are Samvardh. Mothe., Bosch, Schaeffler India, Bharat Forge, Tube Investments, Lumax Auto Tech., Pricol Ltd, Sundaram Clayton, Subros, and Rolex Rings.<BR><BR>Quality Snapshot: Excellent management risk is observed at Bosch, Schaeffler India, Tube Investments, Lumax Auto Tech., and Sharda Motor, while Good management risk is found at Samvardh. Mothe., Bharat Forge, Pricol Ltd, Sundaram Clayton, and Subros. Average management risk is noted for Samvardh. Mothe. and Sundaram Clayton, while Below Average management risk is seen at Subros. For Growth, Excellent growth is exhibited by Samvardh. Mothe., Schaeffler India, Tube Investments, Lumax Auto Tech., and Sharda Motor, while Good growth is found at Bharat Forge and Pricol Ltd. Average growth is observed at Bosch, and Below Average growth is noted for Subros. In terms of Capital Structure, Excellent capital structure is present at Bosch, Schaeffler India, Tube Investments, Lumax Auto Tech., and Sharda Motor, while Good capital structure is seen at Samvardh. Mothe., Pricol Ltd, and Sundaram Clayton. Average capital structure is noted for Bharat Forge, while Below Average capital structure is found at Sundaram Clayton.<BR><BR>Return Snapshot: Lumax Auto Tech. has the highest 1-year return at 94.18%, while Bharat Forge has the lowest at -20.70%. Sharda Motor's 1-year return of 19.67% is higher than Bharat Forge's but lower than Lumax Auto Tech.'s. Additionally, peers with negative six-month returns include Samvardh. Mothe., Tube Investments, and Rolex Rings.

View full answer

What is the bonus history of Sharda Motor?

01-Jul-2025

Sharda Motor Industries Ltd recently announced a 1:1 bonus issue, with an ex-date of July 4, 2025, meaning shareholders will receive one additional share for each share they own on that date.

Sharda Motor Industries Ltd has a recent bonus issue where they announced a 1:1 bonus. The ex-date for this bonus is set for July 4, 2025. This means that shareholders will receive one additional share for every share they own on that date.

View full answer

Who are in the management team of Sharda Motor?

16-Jul-2025

As of March 2023, the management team of Sharda Motor includes Kishan N Parikh, Ashok Kumar Bhattacharya, Sharda Relan, Udayan Banerjee, Sarita Dhuper, Ajay Relan, and Nitin Vishnoi, bringing diverse expertise to the company's leadership.

As of March 2023, the management team of Sharda Motor includes the following individuals:<BR><BR>1. Kishan N Parikh - Independent Non Executive Director<BR>2. Ashok Kumar Bhattacharya - Independent Non Executive Director<BR>3. Sharda Relan - Non Executive Director<BR>4. Udayan Banerjee - Independent Non Executive Director<BR>5. Sarita Dhuper - Independent Non Executive Director<BR>6. Ajay Relan - Executive Director<BR>7. Nitin Vishnoi - Executive Director & Company Secretary<BR><BR>These members bring a diverse range of expertise to the company's leadership.

View full answer

How big is Sharda Motor?

24-Jul-2025

As of 24th July, Sharda Motor Industries Ltd has a market capitalization of 6,618.00 Cr, with recent net sales of 2,836.56 Cr and a net profit of 314.92 Cr over the last four quarters.

As of 24th July, <BR><BR>Market Cap: Sharda Motor Industries Ltd has a market capitalization of 6,618.00 Cr, classifying it as a Mid Cap company.<BR><BR>Recent Quarterly Performance: The sum of Net Sales for the latest 4 quarters is 2,836.56 Cr, while the sum of Net Profit for the same period is 314.92 Cr.<BR><BR>Balance Sheet Snapshot: The reporting period is for March 2024, with Shareholder's Funds amounting to 1,005.89 Cr and Total Assets totaling 1,622.54 Cr.

View full answer

Is Sharda Motor overvalued or undervalued?

13-Nov-2025

As of November 12, 2025, Sharda Motor is considered undervalued with a valuation grade upgrade to attractive, featuring a PE ratio of 19.02, significantly lower than peers like Samvardhana Motherson and Bosch, while delivering strong long-term returns of 169.72% over three years.

As of 12 November 2025, Sharda Motor's valuation grade has moved from fair to attractive, indicating a positive shift in its perceived value. The company is currently considered undervalued based on its financial metrics. Key ratios include a PE Ratio of 19.02, an EV to EBITDA of 13.10, and a ROE of 29.66%. <BR><BR>In comparison to peers, Sharda Motor's PE ratio is significantly lower than that of Samvardhana Motherson, which stands at 32.72, and Bosch, which is at 48.27. This suggests that Sharda Motor may be undervalued relative to its peers in the auto components industry. Additionally, despite recent stock performance lagging behind the Sensex over the past week and month, the company has shown strong returns over the longer term, with a 3-year return of 169.72% compared to the Sensex's 36.69%.

View full answer

How has been the historical performance of Sharda Motor?

19-Nov-2025

Sharda Motor has shown consistent growth from March 2020 to March 2025, with net sales increasing from INR 862.99 crore to INR 2,836.57 crore, and profit after tax rising from INR 57.75 crore to INR 312.44 crore, indicating strong operational efficiency and market positioning. Total assets and cash flow from operations also improved significantly during this period.

Answer:<BR>The historical performance of Sharda Motor shows a consistent growth trend in net sales and profitability over the years, culminating in the fiscal year ending March 2025.<BR><BR>Breakdown:<BR>Sharda Motor's net sales have steadily increased from INR 862.99 crore in March 2020 to INR 2,836.57 crore in March 2025, reflecting a strong upward trajectory. The total operating income also followed this trend, reaching INR 2,836.57 crore in March 2025, up from INR 862.99 crore in March 2020. The company's operating profit (PBDIT) has shown significant growth, rising from INR 119.61 crore in March 2020 to INR 479.65 crore in March 2025, indicating improved operational efficiency. Profit before tax has also increased from INR 78.48 crore in March 2020 to INR 417.49 crore in March 2025, while profit after tax rose from INR 57.75 crore to INR 312.44 crore over the same period. The company's total assets have expanded from INR 622.19 crore in March 2020 to INR 1,754.66 crore in March 2025, with total liabilities increasing from INR 622.19 crore to INR 1,754.66 crore, indicating a proportional growth in both assets and liabilities. Cash flow from operating activities improved significantly, reaching INR 270 crore in March 2025, compared to a negative cash flow of INR 63 crore in March 2020. Overall, Sharda Motor has demonstrated robust growth in sales, profits, and asset base, positioning itself favorably in the market.

View full answer

Is Sharda Motor technically bullish or bearish?

03-Dec-2025

As of December 2, 2025, Sharda Motor's trend is mildly bearish, indicated by bearish MACD readings and Bollinger Bands, despite neutral RSI and mildly bullish daily moving averages, with the current price at 968.00 down from 974.60.

As of 2 December 2025, the technical trend for Sharda Motor has changed from sideways to mildly bearish. The current stance is mildly bearish, driven by weekly and monthly MACD readings indicating bearish momentum, along with Bollinger Bands and KST also showing mildly bearish signals. The RSI is neutral with no signals in both weekly and monthly time frames. Although daily moving averages are mildly bullish, the overall weekly indicators suggest a bearish sentiment. The Dow Theory indicates a mildly bearish trend on the weekly chart, while the monthly chart shows no trend. The recent price action, with a current price of 968.00 down from a previous close of 974.60, further supports this bearish outlook.

View full answer

When is the next results date for Sharda Motor Industries Ltd?

15-May-2026

The next results date for Sharda Motor Industries Ltd is 21 May 2026.

The next results date for Sharda Motor Industries Ltd is scheduled for 21 May 2026.

View full answer

Are Sharda Motor Industries Ltd latest results good or bad?

22-May-2026

Sharda Motor Industries Ltd's latest results show strong revenue growth of 29.59% year-on-year, reaching ₹971.76 crores, but profitability is a concern with net profit growth lagging at 6.53% and declining operating margins at 11.62%. Investors should monitor these margin trends closely as they impact future performance.

Sharda Motor Industries Ltd's latest results present a mixed picture. On one hand, the company achieved a record revenue of ₹971.76 crores for Q4 FY26, reflecting a strong year-on-year growth of 29.59% and a sequential growth of 10.23%. This indicates robust demand and effective market positioning, particularly in the auto components sector.<BR><BR>However, the profitability metrics reveal some concerns. The net profit increased to ₹89.42 crores, which is a 6.53% rise year-on-year, but this growth lags significantly behind the revenue increase. Additionally, the operating margin has contracted to 11.62%, down from 13.44% a year ago, indicating pressures from rising costs or operational inefficiencies.<BR><BR>Overall, while Sharda Motor has demonstrated impressive revenue growth, the declining margins and slower profit growth suggest that the company is facing challenges in maintaining profitability. Investors may want to monitor these margin trends closely, as they will be crucial for the company's future performance.

View full answer

Should I buy, sell or hold Sharda Motor Industries Ltd?

23-May-2026

Why is Sharda Motor Industries Ltd falling/rising?

24-May-2026

As of 24-May, Sharda Motor Industries Ltd's stock price is at 854.70, down 4.84% after a trend reversal following six days of gains. The stock has underperformed its sector and the benchmark Sensex, with a year-to-date decline of 9.33%.

As of 24-May, Sharda Motor Industries Ltd's stock price is falling, currently at 854.70, reflecting a decrease of 43.45 (-4.84%). This decline follows a trend reversal after six consecutive days of gains. Despite opening the day with a gain of 2.98% and reaching an intraday high of Rs 924.95, the stock experienced significant volatility, trading within a wide range of Rs 87.8, and hitting a low of Rs 837.15, which represents a decrease of 6.79% from its opening price.<BR><BR>The stock has underperformed its sector by 5.83% today, indicating a lack of positive momentum compared to its peers. Over the past week, the stock has decreased by 2.22%, while the benchmark Sensex has increased by 0.24%. Additionally, the stock has shown a year-to-date decline of 9.33%, which is less severe than the Sensex's drop of 11.51%. However, the annual performance is notably poor, with a decrease of 12.65% compared to the Sensex's decline of 6.84%.<BR><BR>Despite some positive indicators, such as high management efficiency and a net-debt-free status, the stock's current performance reflects a negative sentiment among investors, likely influenced by the recent volatility and underperformance relative to the sector.

View full answer
iScoreScore
Click here to find our call on this stock
Strong Sell
Sell
Hold
Buy
Strong Buy

Dashboard

1

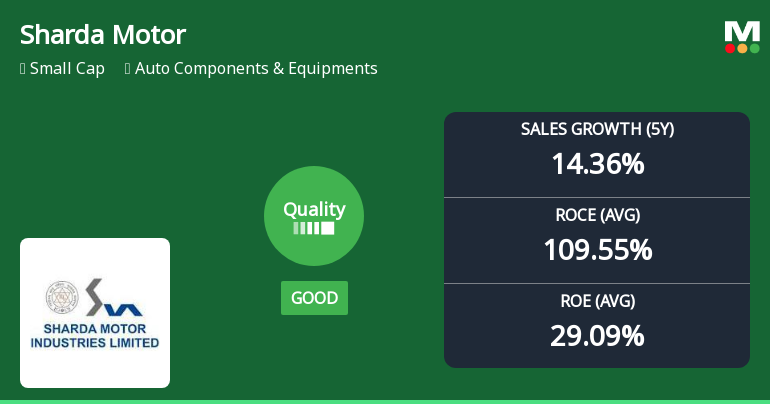
High Management Efficiency with a high ROE of 29.09%

 
2

The company is Net-Debt Free

 
3

Healthy long term growth as Operating profit has grown by an annual rate 33.03%

 
4

Positive results in Mar 26

5

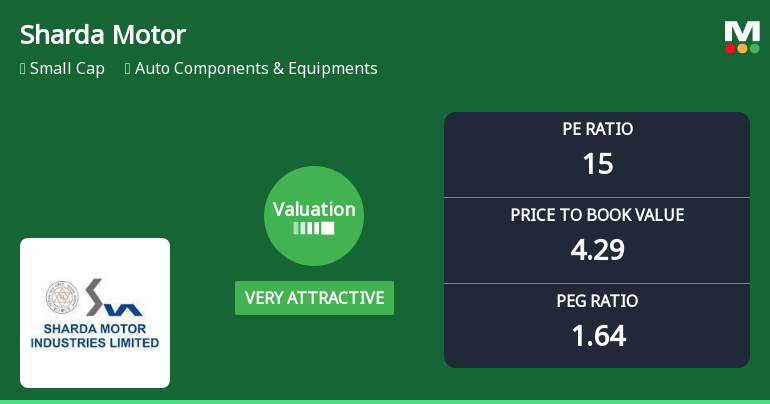
With ROE of 27.7, it has a Very Attractive valuation with a 4.3 Price to Book Value

6

Majority shareholders : Promoters

 
7

Underperformed the market in the last 1 year

stock-summaryMojo Parameters

Mojo Parameters

Loading Valuation Snapshot...

Stock DNA

stock-summary
Industry

Auto Components & Equipments

stock-summary
Market cap

INR 4,880 Cr (Small Cap)

stock-summary
P/E

15.00

stock-summary
Industry P/E

36

stock-summary
Dividend Yield

1.90%

stock-summary
Debt Equity

-0.81

stock-summary
Return on Equity

27.72%

stock-summary
Price to Book

4.29

Revenue and Profits:
Net Sales:
972 Cr
(Quarterly Results - Mar 2026)
Net Profit:
89 Cr
stock-summaryTotal Returns
Total Returns (Price + Dividend) stock-summary
Dividend Yield (1.9%)
TimePeriod
Price Return
Dividend Return
Total Return
3 Months
-11.23%
0%
-11.23%
6 Months
-6.52%
0%
-6.52%
1 Year
-13.44%
3.41%
-10.03%
2 Years
8.37%
5.70%
14.07%
3 Years
119.06%
14.73%
133.79%
4 Years
167.55%
18.86%
186.41%
5 Years
326.97%
30.93%
357.9%

Latest dividend: 32.5 per share ex-dividend date: Jun-13-2025

Risk Adjusted Returns v/s stock-summary
Returns Beta
Icon
Beta has not been calculated since enough price history is not available
stock-summaryNews & Corporate Actions

News

Announcements stock-summary

Sharda Motor Industries Limited - Shareholders meeting

22-Nov-2019 | Source : NSE

Sharda Motor Industries Limited has submitted the Exchange a copy Srutinizers report of Court Convened General Meeting held on November 20, 2019. Further, the company has informed the Exchange regarding voting results.

Sharda Motor Industries Limited - Shareholders meeting

21-Nov-2019 | Source : NSE

Sharda Motor Industries Limited has informed the Exchange regarding Proceedings of Court Convened General Meeting held on November 20, 2019

Sharda Motor Industries Limited - Updates

14-Nov-2019 | Source : NSE

Sharda Motor Industries Limited has informed the Exchange regarding 'please find enclosed herewith copies of the newspaper advertisement published on November 14, 2019 [Financial Express (English Language) and Vir Arjun (Hindi Regional Language)]. This is for your information and records'.

Corporate Actions stock-summary

stock-summary
BOARD MEETING

No Upcoming Board Meetings

stock-summary
DIVIDEND

Sharda Motor Industries Ltd has declared 1625% dividend, ex-date: 13 Jun 25

stock-summary
SPLITS

Sharda Motor Industries Ltd has announced 2:10 stock split, ex-date: 16 Apr 21

stock-summary
BONUS

Sharda Motor Industries Ltd has announced 1:1 bonus issue, ex-date: 04 Jul 25

stock-summary
RIGHTS

No Rights history available

stock-summaryKey Factors

Quality key factors stock-summary

Factor
Value
Sales Growth (5y)
14.36%
EBIT Growth (5y)
33.03%
EBIT to Interest (avg)
100.00
Debt to EBITDA (avg)
Net Debt is too low
Net Debt to Equity (avg)
-0.81
Sales to Capital Employed (avg)
3.35
Tax Ratio
24.74%
Dividend Payout Ratio
29.62%
Pledged Shares
0
Institutional Holding
13.94%
ROCE (avg)
109.55%
ROE (avg)
29.09%

Valuation key factors

Factor
Value
P/E Ratio
15
Industry P/E
36
Price to Book Value
4.29
EV to EBIT
11.21
EV to EBITDA
9.51
EV to Capital Employed
17.96
EV to Sales
1.17
PEG Ratio
1.64
Dividend Yield
1.90%
ROCE (Latest)
150.72%
ROE (Latest)
27.72%

Technicals key factors

Indicator
Weekly
Monthly
MACD
Mildly Bullish
Mildly Bearish
RSI
No Signal
No Signal
Bollinger Bands
Sideways
Bearish
Moving Averages
Mildly Bearish (Daily)
KST
Mildly Bullish
Mildly Bearish
Dow Theory
No Trend
Mildly Bearish
OBV
Mildly Bullish
Mildly Bullish
stock-summary Technical Indicator Scale: Bearish, Mildly Bearish, Sideways, Mildly Bullish, Bullish  Turned 
stock-summaryShareholding
Shareholding Snapshot : Mar 2026stock-summary
Shareholding Compare (%holding) stock-summary
Majority shareholders

Promoters

Pledged Promoter Holdings

None

Mutual Funds

Held by 8 Schemes (11.4%)

FIIs

Held by 73 FIIs (2.43%)

Promoter with highest holding

Smil Trust (ajay Relan Trustee) (46.0%)

Highest Public shareholder

Icici Prudential Flexicap Fund (5.47%)

Individual Investors Holdings

16.39%

stock-summaryFinancial
[
  {
    "link": "quarterly",
    "btn_text": "All Quarterly Results",
    "header": "Quarterly Results Snapshot (Consolidated) - Mar'26 - QoQ",
    "rhs": [
      {
        "prefix": "Net Sales ",
        "suffix": "QoQ Growth in quarter ended Mar 2026 is 10.23% vs 11.98% in Dec 2025",
        "dir": -1
      },
      {
        "prefix": "Consolidated Net Profit ",
        "suffix": "QoQ Growth in quarter ended Mar 2026 is 9.92% vs 8.90% in Dec 2025",
        "dir": 1
      }
    ],
    "table": {
      "header": [
        "Mar'26",
        "Dec'25",
        "Change(%)"
      ],
      "body": [
        {
          "field": "Net Sales",
          "val1": "971.76",
          "val2": "881.55",
          "chgp": "10.23%",
          "chgp_class": "positive"
        },
        {
          "field": "Operating Profit (PBDIT) excl Other Income",
          "val1": "112.88",
          "val2": "106.43",
          "chgp": "6.06%",
          "chgp_class": "positive"
        },
        {
          "field": "Interest",
          "val1": "1.02",
          "val2": "1.14",
          "chgp": "-10.53%",
          "chgp_class": "positive"
        },
        {
          "field": "Exceptional Items",
          "val1": "0.20",
          "val2": "-4.46",
          "chgp": "104.48%",
          "chgp_class": "positive"
        },
        {
          "field": "Consolidate Net Profit",
          "val1": "89.42",
          "val2": "81.35",
          "chgp": "9.92%",
          "chgp_class": "positive"
        },
        {
          "field": "Operating Profit Margin (Excl OI)",
          "val1": "11.62%",
          "val2": "12.07%",
          "chgp": "-0.45%",
          "chgp_class": "negative"
        }
      ]
    }
  },
  {
    "link": "half-yearly",
    "btn_text": "All Half Yearly Results",
    "header": "Half Yearly Results Snapshot (Consolidated) - Sep'25",
    "rhs": [
      {
        "prefix": "Net Sales ",
        "suffix": " Growth in half year ended Sep 2025 is 10.51% vs -1.41% in Sep 2024",
        "dir": 1
      },
      {
        "prefix": "Consolidated Net Profit ",
        "suffix": " Growth in half year ended Sep 2025 is 12.28% vs 14.94% in Sep 2024",
        "dir": -1
      }
    ],
    "table": {
      "header": [
        "Sep'25",
        "Sep'24",
        "Change(%)"
      ],
      "body": [
        {
          "field": "Net Sales",
          "val1": "1,543.46",
          "val2": "1,396.72",
          "chgp": "10.51%",
          "chgp_class": "positive"
        },
        {
          "field": "Operating Profit (PBDIT) excl Other Income",
          "val1": "199.43",
          "val2": "201.07",
          "chgp": "-0.82%",
          "chgp_class": "negative"
        },
        {
          "field": "Interest",
          "val1": "2.18",
          "val2": "0.98",
          "chgp": "122.45%",
          "chgp_class": "negative"
        },
        {
          "field": "Exceptional Items",
          "val1": "22.41",
          "val2": "0.00",
          "chgp": "",
          "chgp_class": "neutral"
        },
        {
          "field": "Consolidate Net Profit",
          "val1": "174.64",
          "val2": "155.54",
          "chgp": "12.28%",
          "chgp_class": "positive"
        },
        {
          "field": "Operating Profit Margin (Excl OI)",
          "val1": "12.92%",
          "val2": "14.40%",
          "chgp": "-1.48%",
          "chgp_class": "negative"
        }
      ]
    }
  },
  {
    "link": "nine-monthly",
    "btn_text": "All Nine Monthly Results",
    "header": "Nine Monthly Results Snapshot (Consolidated) - Dec'25",
    "rhs": [
      {
        "prefix": "Net Sales ",
        "suffix": "YoY Growth in nine months ended Dec 2025 is 16.21% vs -0.91% in Dec 2024",
        "dir": 1
      },
      {
        "prefix": "Consolidated Net Profit ",
        "suffix": "YoY Growth in nine months ended Dec 2025 is 10.83% vs 9.32% in Dec 2024",
        "dir": 1
      }
    ],
    "table": {
      "header": [
        "Dec'25",
        "Dec'24",
        "Change(%)"
      ],
      "body": [
        {
          "field": "Net Sales",
          "val1": "2,425.01",
          "val2": "2,086.71",
          "chgp": "16.21%",
          "chgp_class": "positive"
        },
        {
          "field": "Operating Profit (PBDIT) excl Other Income",
          "val1": "305.86",
          "val2": "295.57",
          "chgp": "3.48%",
          "chgp_class": "positive"
        },
        {
          "field": "Interest",
          "val1": "3.32",
          "val2": "1.56",
          "chgp": "112.82%",
          "chgp_class": "negative"
        },
        {
          "field": "Exceptional Items",
          "val1": "17.95",
          "val2": "0.00",
          "chgp": "",
          "chgp_class": "neutral"
        },
        {
          "field": "Consolidate Net Profit",
          "val1": "255.99",
          "val2": "230.98",
          "chgp": "10.83%",
          "chgp_class": "positive"
        },
        {
          "field": "Operating Profit Margin (Excl OI)",
          "val1": "12.61%",
          "val2": "14.16%",
          "chgp": "-1.55%",
          "chgp_class": "negative"
        }
      ]
    }
  },
  {
    "link": "annual",
    "btn_text": "All Annual Results",
    "header": "Annual Results Snapshot (Consolidated) - Mar'26",
    "rhs": [
      {
        "prefix": "Net Sales ",
        "suffix": "YoY Growth in year ended Mar 2026 is 19.75% vs 0.97% in Mar 2025",
        "dir": 1
      },
      {
        "prefix": "Consolidated Net Profit ",
        "suffix": "YoY Growth in year ended Mar 2026 is 9.68% vs 5.12% in Mar 2025",
        "dir": 1
      }
    ],
    "table": {
      "header": [
        "Mar'26",
        "Mar'25",
        "Change(%)"
      ],
      "body": [
        {
          "field": "Net Sales",
          "val1": "3,396.77",
          "val2": "2,836.57",
          "chgp": "19.75%",
          "chgp_class": "positive"
        },
        {
          "field": "Operating Profit (PBDIT) excl Other Income",
          "val1": "418.75",
          "val2": "396.37",
          "chgp": "5.65%",
          "chgp_class": "positive"
        },
        {
          "field": "Interest",
          "val1": "4.33",
          "val2": "3.93",
          "chgp": "10.18%",
          "chgp_class": "negative"
        },
        {
          "field": "Exceptional Items",
          "val1": "18.15",
          "val2": "0.00",
          "chgp": "",
          "chgp_class": "neutral"
        },
        {
          "field": "Consolidate Net Profit",
          "val1": "345.41",
          "val2": "314.92",
          "chgp": "9.68%",
          "chgp_class": "positive"
        },
        {
          "field": "Operating Profit Margin (Excl OI)",
          "val1": "12.33%",
          "val2": "13.97%",
          "chgp": "-1.64%",
          "chgp_class": "negative"
        }
      ]
    }
  }
]

Quarterly Results Snapshot (Consolidated) - Mar'26 - QoQstock-summary

Mar'26
Dec'25
Change(%)
Net Sales
971.76
881.55
10.23%
Operating Profit (PBDIT) excl Other Income
112.88
106.43
6.06%
Interest
1.02
1.14
-10.53%
Exceptional Items
0.20
-4.46
104.48%
Consolidate Net Profit
89.42
81.35
9.92%
Operating Profit Margin (Excl OI)
11.62%
12.07%
-0.45%
Values in Rs Cr.
Direction Arrows
Net Sales

QoQ Growth in quarter ended Mar 2026 is 10.23% vs 11.98% in Dec 2025

Direction Arrows
Consolidated Net Profit

QoQ Growth in quarter ended Mar 2026 is 9.92% vs 8.90% in Dec 2025

Half Yearly Results Snapshot (Consolidated) - Sep'25stock-summary

Sep'25
Sep'24
Change(%)
Net Sales
1,543.46
1,396.72
10.51%
Operating Profit (PBDIT) excl Other Income
199.43
201.07
-0.82%
Interest
2.18
0.98
122.45%
Exceptional Items
22.41
0.00
Consolidate Net Profit
174.64
155.54
12.28%
Operating Profit Margin (Excl OI)
12.92%
14.40%
-1.48%
Values in Rs Cr.
Direction Arrows
Net Sales

Growth in half year ended Sep 2025 is 10.51% vs -1.41% in Sep 2024

Direction Arrows
Consolidated Net Profit

Growth in half year ended Sep 2025 is 12.28% vs 14.94% in Sep 2024

Nine Monthly Results Snapshot (Consolidated) - Dec'25stock-summary

Dec'25
Dec'24
Change(%)
Net Sales
2,425.01
2,086.71
16.21%
Operating Profit (PBDIT) excl Other Income
305.86
295.57
3.48%
Interest
3.32
1.56
112.82%
Exceptional Items
17.95
0.00
Consolidate Net Profit
255.99
230.98
10.83%
Operating Profit Margin (Excl OI)
12.61%
14.16%
-1.55%
Values in Rs Cr.
Direction Arrows
Net Sales

YoY Growth in nine months ended Dec 2025 is 16.21% vs -0.91% in Dec 2024

Direction Arrows
Consolidated Net Profit

YoY Growth in nine months ended Dec 2025 is 10.83% vs 9.32% in Dec 2024

Annual Results Snapshot (Consolidated) - Mar'26stock-summary

Mar'26
Mar'25
Change(%)
Net Sales
3,396.77
2,836.57
19.75%
Operating Profit (PBDIT) excl Other Income
418.75
396.37
5.65%
Interest
4.33
3.93
10.18%
Exceptional Items
18.15
0.00
Consolidate Net Profit
345.41
314.92
9.68%
Operating Profit Margin (Excl OI)
12.33%
13.97%
-1.64%
Values in Rs Cr.
Direction Arrows
Net Sales

YoY Growth in year ended Mar 2026 is 19.75% vs 0.97% in Mar 2025

Direction Arrows
Consolidated Net Profit

YoY Growth in year ended Mar 2026 is 9.68% vs 5.12% in Mar 2025

stock-summaryCompany CV
About Sharda Motor Industries Ltd stock-summary
stock-summary
Sharda Motor Industries Ltd
Small Cap
Auto Components & Equipments
Sharda Motor Industries Limited was incorporated on January 29, 1986 under the Companies Act, 1956 with the Registrar of Companies NCT Delhi & Haryana and received the Certificate of Commencement of Business on January 31, 1986. The Company's production range includes Exhaust Systems, Catalytic Converters, Suspension Systems, Sheet Metal Components and Plastic parts for Automotive.
Company Coordinates stock-summary
Company Details
D-188 Okhla Industrial Area, Phase-1 New Delhi New Delhi : 110020
stock-summary
Tel: 91-11-47334100
stock-summary
smil@shardamotor.com
Registrar Details
Alankit Assignments Ltd , Alankit House , 2 E/21, Jhandewala Extension, New Delhi