
Compare Sundaram Brake with Similar Stocks
Dashboard
Weak Long Term Fundamental Strength with an average Return on Capital Employed (ROCE) of 2.93%
- Poor long term growth as Net Sales has grown by an annual rate of 7.79% and Operating profit at 3.36% over the last 5 years
- Company's ability to service its debt is weak with a poor EBIT to Interest (avg) ratio of 0.57
With ROCE of 1.5, it has a Expensive valuation with a 2.4 Enterprise value to Capital Employed
Underperformed the market in the last 1 year
Stock DNA
Auto Components & Equipments
INR 307 Cr (Micro Cap)
117.00
37
0.08%
0.45
2.53%
2.99
Total Returns (Price + Dividend) 
Latest dividend: 0.6 per share ex-dividend date: Jul-17-2026
Risk Adjusted Returns v/s
Returns Beta

News
When is the next results date for Sundaram Brake Linings Ltd?
The next results date for Sundaram Brake Linings Ltd is scheduled for 08 August 2026....
Read full news article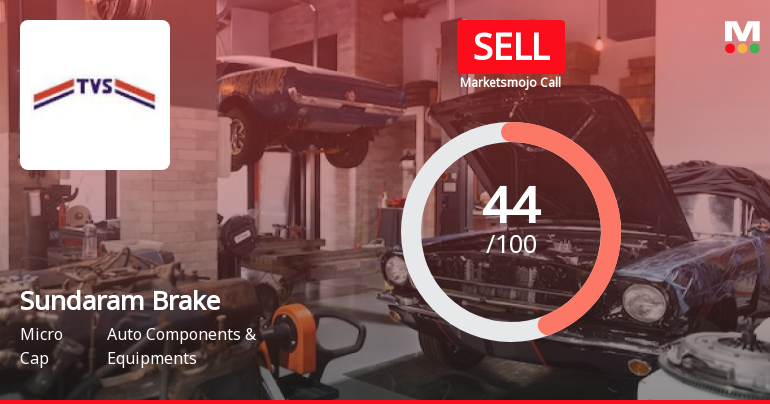
Sundaram Brake Linings Ltd is Rated Sell
Sundaram Brake Linings Ltd is rated 'Sell' by MarketsMOJO, with this rating last updated on 29 June 2026. However, the analysis and financial metrics discussed here reflect the stock's current position as of 22 July 2026, providing investors with the most up-to-date perspective on the company’s performance and outlook.
Read full news article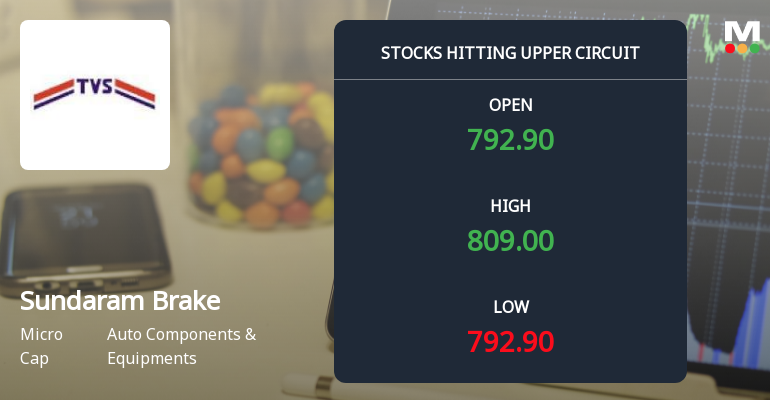
Sundaram Brake Linings Ltd Locks at Upper Circuit With 5.0% Gain — Buyers Queue, Sellers Absent
At Rs 816.1, the buying was done — not because demand dried up, but because the exchange wouldn't let the stock go any higher. Sundaram Brake Linings Ltd locked at its upper circuit of 5.0% on 13 Jul 2026, with buyers queuing and no sellers willing to part with shares.
Read full news article Announcements
Sundaram Brake Linings Limited - Credit Rating
27-Nov-2019 | Source : NSESundaram Brake Linings Limited has informed the Exchange regarding Credit Rating
Sundaram Brake Linings Limited - Other General Purpose
18-Nov-2019 | Source : NSESundaram Brake Linings Limited has informed the Exchange regarding disclosure of Related Party Transactions for the half year ended September 30, 2019ápursuant to Regulation 23 (9) of the SEBI (Listing Obligations and Disclosure Requirements) Regulations, 2015
Reply to Clarification Sought
28-Aug-2019 | Source : NSE
| SUNDRMBRAK: The Exchange had sought clarification from Sundaram Brake Linings Limited with respect to announcement dated 13-Aug-2019, regarding Appointment of Ms Shobhana Ramachandran as Non- Executive Director of the company w.e.f. August 13, 2019. On basis of above the Company was required to clarify following: 1. Disclosure of relationships between directors (in case of appointment of a director) 2. Brief profile (in case of appointment). The response of the Company is attached. |
Corporate Actions

08 Aug 2026

Sundaram Brake Linings Ltd has declared 6% dividend, ex-date: 17 Jul 26

No Splits history available

No Bonus history available

Sundaram Brake Linings Ltd has announced 9:20 rights issue, ex-date: 14 May 09
Quality key factors
Valuation key factors
Technicals key factors
 Technical Indicator Scale: Bearish, Mildly Bearish, Sideways, Mildly Bullish, Bullish Turned
 Shareholding Snapshot : Jun 2026
Shareholding Compare (%holding)
Promoters
None
Held by 0 Schemes
Held by 0 FIIs
Madurai Alagar Enterprises Private Limited (32.67%)
Equity Intelligence India Private Limited (1.68%)
28.73%
Quarterly Results Snapshot (Standalone) - Mar'26 - QoQ

QoQ Growth in quarter ended Mar 2026 is 7.41% vs 7.89% in Dec 2025

QoQ Growth in quarter ended Mar 2026 is 702.42% vs 60.26% in Dec 2025
Half Yearly Results Snapshot (Standalone) - Sep'25
Growth in half year ended Sep 2025 is 1.84% vs -6.49% in Sep 2024
Growth in half year ended Sep 2025 is -223.65% vs -53.46% in Sep 2024
Nine Monthly Results Snapshot (Standalone) - Dec'25
YoY Growth in nine months ended Dec 2025 is -0.40% vs -3.07% in Dec 2024
YoY Growth in nine months ended Dec 2025 is -227.27% vs -59.56% in Dec 2024
Annual Results Snapshot (Standalone) - Mar'26
YoY Growth in year ended Mar 2026 is -2.15% vs -0.04% in Mar 2025
YoY Growth in year ended Mar 2026 is -50.29% vs -48.76% in Mar 2025
About Sundaram Brake Linings Ltd

Company Coordinates


