
Compare Alkali Metals with Similar Stocks
Dashboard
Weak Long Term Fundamental Strength with an average Return on Capital Employed (ROCE) of 6.15%
- Poor long term growth as Net Sales has grown by an annual rate of 10.93% and Operating profit at 11.45% over the last 5 years
- Company's ability to service its debt is weak with a poor EBIT to Interest (avg) ratio of 1.33
30.06% of Promoter Shares are Pledged
Consistent Underperformance against the benchmark over the last 3 years
Stock DNA
Specialty Chemicals
INR 87 Cr (Micro Cap)
159.00
18
0.56%
0.38
1.28%
2.03
Total Returns (Price + Dividend) 
Latest dividend: 0.5 per share ex-dividend date: Aug-14-2025
Risk Adjusted Returns v/s
Returns Beta

News

Alkali Metals Ltd Valuation Shifts Signal Renewed Price Attractiveness Amid Specialty Chemicals Sector
Alkali Metals Ltd, a micro-cap player in the Specialty Chemicals sector, has witnessed a notable shift in its valuation parameters, moving from a fair to an attractive rating. Despite a recent day decline of 2.19%, the company’s price-to-earnings (P/E) and price-to-book value (P/BV) ratios suggest a recalibration of price attractiveness relative to its historical averages and peer group, offering investors a fresh perspective on its market positioning.
Read full news article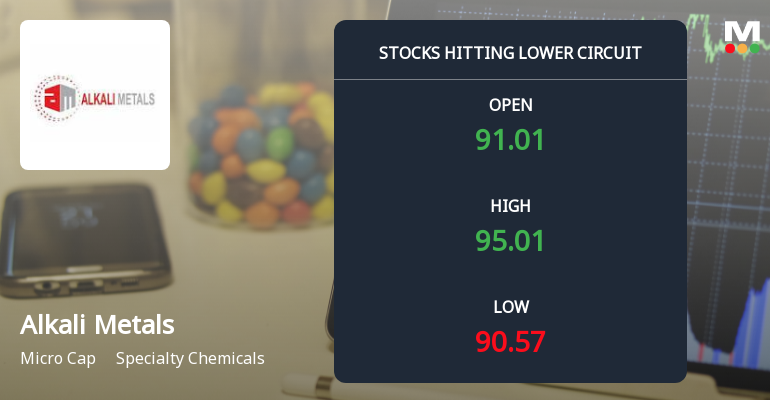
Alkali Metals Ltd Locks at Lower Circuit With 5% Loss — Sellers Queue, No Buyers in Sight
At Rs 90.17, sellers were still queuing — but there were no buyers willing to take the other side. Alkali Metals Ltd locked at its lower circuit of 5% on 4 Jun 2026, with unfilled sell orders and a frozen price, reflecting persistent selling pressure in a micro-cap stock with limited liquidity.
Read full news article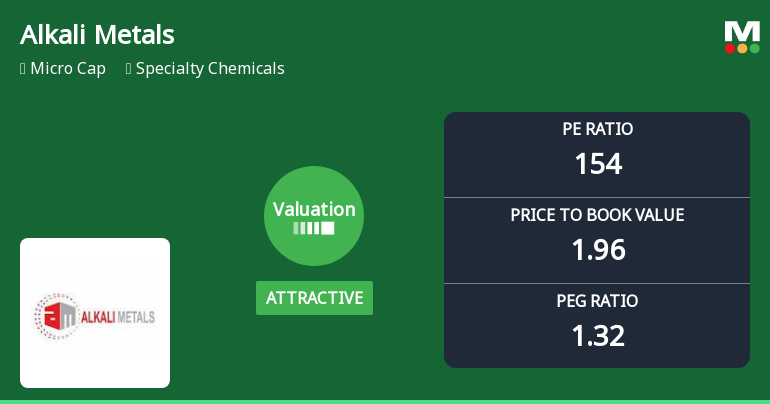
Alkali Metals Ltd Valuation Shifts Signal Renewed Price Attractiveness Amid Specialty Chemicals Sector
Alkali Metals Ltd has witnessed a notable shift in its valuation parameters, moving from a fair to an attractive rating, despite a recent 3.42% decline in its share price. The specialty chemicals company’s price-to-earnings (P/E) ratio now stands at a lofty 153.99, while its price-to-book value (P/BV) has settled at 1.96, signalling a nuanced change in price attractiveness relative to its historical and peer benchmarks.
Read full news article Announcements
Alkali Metals Limited - Other General Purpose
15-Nov-2019 | Source : NSEAlkali Metals Limited has informed the Exchange regarding disclosure of Related Party Transactions under Regulation 23(9) of SEBI (Listing Obligations and Disclosure Requirements) Regulations 2015 for the half year ended September, 30,2019.
Alkali Metals Limited - Updates
16-Oct-2019 | Source : NSEAlkali Metals Limited has informed the Exchange regarding 'Receipt of Certificate under 74(5) of Depositories and Participants Regulations 2018 from M/s. Cameo Corporate Services Limited for the Quarter ended 30th September, 2019'.
Shareholders meeting
31-Aug-2019 | Source : NSE
| Alkali Metals Limited has informed the Exchange with copy of minutes of Annual General Meeting held on August 03, 2019 |
Corporate Actions

No Upcoming Board Meetings

Alkali Metals Ltd has declared 5% dividend, ex-date: 14 Aug 25

No Splits history available

No Bonus history available

No Rights history available
Quality key factors
Valuation key factors
Technicals key factors
 Technical Indicator Scale: Bearish, Mildly Bearish, Sideways, Mildly Bullish, Bullish Turned
 Shareholding Snapshot : Mar 2026
Shareholding Compare (%holding)
Promoters
30.0599
Held by 0 Schemes
Held by 0 FIIs
Yerramilli Sri Rama Venkata Rao (67.81%)
None
28.35%
Quarterly Results Snapshot (Standalone) - Mar'26 - YoY

YoY Growth in quarter ended Mar 2026 is 15.52% vs 1.84% in Mar 2025

YoY Growth in quarter ended Mar 2026 is -7.59% vs 676.79% in Mar 2025
Half Yearly Results Snapshot (Standalone) - Sep'25
Growth in half year ended Sep 2025 is 12.13% vs 3.63% in Sep 2024
Growth in half year ended Sep 2025 is 60.34% vs -2,585.71% in Sep 2024
Nine Monthly Results Snapshot (Standalone) - Dec'25
YoY Growth in nine months ended Dec 2025 is 11.89% vs -1.68% in Dec 2024
YoY Growth in nine months ended Dec 2025 is 65.91% vs -1,880.70% in Dec 2024
Annual Results Snapshot (Standalone) - Mar'26
YoY Growth in year ended Mar 2026 is 13.00% vs -0.64% in Mar 2025
YoY Growth in year ended Mar 2026 is 109.66% vs -613.27% in Mar 2025
About Alkali Metals Ltd

Company Coordinates


