Shekhawati Inds

  • Market Cap: Micro Cap
  • Industry: Garments & Apparels
  • ISIN: INE268L01046
  • NSEID: SHEKHAWATI
  • BSEID: 533301
INR
14.20
-0.09 (-0.63%)
BSENSE

Aug 05, 10:54 AM

BSE+NSE Vol: 49.95 k

  • Price Points
  • Score
  • Mojo Parameters
  • Total Return
  • News and Corporate Actions
  • Key factors
  • Shareholding
  • Financials
  • CompanyCV
stock-summaryPrice Point
High/Low

1Day

52 Week

Valuation
Technical
Day's Volume

CASH

49.95 k (237.46%) Volume

Shareholding (Jun 2026)

FII

0.00%

Held by 0 FIIs

DII

0.00%

Held by 0 DIIs

Promoter

64.08%

Why is Shekhawati Industries Ltd falling/rising?

05-Aug-2026

As of 04-Aug, Shekhawati Industries Ltd's stock price has risen to 14.43, reflecting a 5.56% increase, driven by strong performance relative to its sector and increased investor participation. The stock has gained for three consecutive days and is currently above its shorter-term moving averages, indicating a short-term bullish trend.

As of 04-Aug, Shekhawati Industries Ltd is experiencing a rise in its stock price, currently at 14.43, with a change of 0.76, representing an increase of 5.56%. This upward movement can be attributed to several factors. Firstly, the stock has outperformed its sector by 5.05% today, indicating strong relative performance. Additionally, it has been on a positive trend, gaining for the last three consecutive days and achieving a total return of 18.57% during this period.<BR><BR>Investor participation has also increased significantly, with a delivery volume of 55.73 thousand on 03 August, which is up by 173.25% compared to the 5-day average delivery volume. This surge in trading activity suggests growing interest and confidence among investors. Furthermore, the stock's current price is higher than its 5-day, 20-day, 50-day, and 100-day moving averages, although it remains below the 200-day moving average. This positioning relative to moving averages can indicate a short-term bullish trend.<BR><BR>Overall, the combination of strong recent performance, increased investor participation, and favorable comparisons to sector performance contributes to the rising stock price of Shekhawati Industries Ltd.

View full answer

When is the next results date for Shekhawati Industries Ltd?

04-Aug-2026

The next results date for Shekhawati Industries Ltd is 12 August 2026.

The next results date for Shekhawati Industries Ltd is scheduled for 12 August 2026.

View full answer

Should I buy, sell or hold Shekhawati Industries Ltd?

21-Jul-2026

How big is Shekhawati Inds?

11-Jun-2026

As of 10th June, Shekhawati Industries Ltd has a market capitalization of 49.00 Cr, classified as a Micro Cap, with recent net sales of 16.27 Cr and net profit of 8.80 Cr over the last four quarters.

As of 10th June, <BR><BR>Market Cap: Shekhawati Industries Ltd has a market capitalization of 49.00 Cr and is classified as a Micro Cap.<BR><BR>Recent Quarterly Performance: The sum of Net Sales for the latest 4 quarters is 16.27 Cr, while the sum of Net Profit for the same period is 8.80 Cr.<BR><BR>Balance Sheet Snapshot: The reporting period is March 2026, with Shareholder's Funds amounting to 21.99 Cr and Total Assets at 31.90 Cr.

View full answer

Who are in the management team of Shekhawati Inds?

11-Jun-2026

The management team of Shekhawati Industries includes Mukesh Ruia (Chairman & Managing Director), Ravi Jogi (Executive Director), and four independent directors: Sushil Kumar Poddar, Nirmal Bagri, Shweta Mundra, and Sudha Agarwal.

The management team of Shekhawati Industries includes:<BR><BR>1. Mukesh Ruia - Chairman & Managing Director<BR>2. Ravi Jogi - Executive Director & Wholetime Director<BR>3. Sushil Kumar Poddar - Independent Director<BR>4. Nirmal Bagri - Independent Director<BR>5. Shweta Mundra - Independent Non-Executive Director<BR>6. Sudha Agarwal - Independent Non-Executive Director<BR><BR>If you need more information about any specific member or their roles, feel free to ask!

View full answer

Who are the peers of the Shekhawati Inds?

11-Jun-2026

Peers of Shekhawati Inds include Trident Texofab, Parmeshwari Silk, Vinny Overseas, SVP Global, Celebrity Fash., Gujarat Cotex, Sambandam Spg., and Mohite Industrie. Parmeshwari Silk shows the highest 1-year return at 622.42%, while Shekhawati Inds has a return of -38.75%.

Peers: The peers of Shekhawati Inds are Trident Texofab, Parmeshwari Silk, Vinny Overseas, SVP Global, Celebrity Fash., Gujarat Cotex, Sambandam Spg., Mohite Industrie.<BR><BR>Quality Snapshot: Below Average management risk is observed at Trident Texofab, Vinny Overseas, SVP Global, Celebrity Fash., Gujarat Cotex, Sambandam Spg., and Mohite Industrie, while Average management risk is found at Parmeshwari Silk and Shekhawati Inds. Growth is rated as Below Average for Trident Texofab, Vinny Overseas, SVP Global, Celebrity Fash., Gujarat Cotex, Sambandam Spg., and Mohite Industrie, while Average growth is noted for Parmeshwari Silk and Shekhawati Inds. Capital Structure is rated as Below Average for Trident Texofab, Vinny Overseas, SVP Global, Celebrity Fash., Gujarat Cotex, Sambandam Spg., and Mohite Industrie, with Average capital structure for Parmeshwari Silk and Shekhawati Inds.<BR><BR>Return Snapshot: Parmeshwari Silk has the highest 1-year return at 622.42%, while Trident Texofab has the lowest at -81.70%. Shekhawati Inds' 1-year return of -38.75% is better than Trident Texofab's but worse than Parmeshwari Silk's. Additionally, several peers, including Trident Texofab, Vinny Overseas, Celebrity Fash., Gujarat Cotex, and Mohite Industrie, have negative six-month returns.

View full answer

What does Shekhawati Inds do?

10-Jun-2026

Shekhawati Industries Ltd is a Micro Cap company in the Garments & Apparels industry, originally founded in 1990 and renamed in 2024. As of March 2026, it reported net sales of 8 Cr and a net profit of 5 Cr, with a market cap of INR 49 Cr.

Overview: <BR>Shekhawati Industries Ltd operates in the Garments & Apparels industry and is classified as a Micro Cap company.<BR><BR>History: <BR>The company was initially incorporated in 1990 as 'Shekhawati Poly-Yarn Private Limited'. It transitioned to a public limited company in April 2010, changing its name to Shekhawati Poly-Yarn Limited, and was renamed Shekhawati Industries Limited on July 23, 2024. The latest reported quarter for net sales and profit is March 2026.<BR><BR>Financial Snapshot: <BR>Net Sales: 8 Cr (Quarterly Results - Mar 2026) <BR>Net Profit: 5 Cr (Quarterly Results - Mar 2026) <BR>Market Cap: INR 49 Cr (Micro Cap)<BR><BR>Key Metrics: <BR>P/E: 6.00 <BR>Industry P/E: 23 <BR>Dividend Yield: 0.00% <BR>Debt Equity: -0.19 <BR>Return on Equity: 40.02% <BR>Price to Book: 2.33 <BR><BR>Contact Details: <BR>Address: Plot No 185/1 Naroli Village, Near Kanadi Phatak Silvassa Dadra & Nagar Haveli (U T) : 396235 <BR>Tel: 91-260-2650666 <BR>Email: unit3@shekhawatiyarn.com <BR>Website: http://www.shekhawatiyarn.com

View full answer

Are Shekhawati Industries Ltd latest results good or bad?

28-Apr-2026

Shekhawati Industries Ltd's latest results show a significant profit increase of 1007.84% to ₹4.63 crores, with improved operating margins; however, revenue declined by 25.73% year-on-year, raising concerns about sustainability and long-term growth. Overall, while profitability has recovered, ongoing revenue challenges are a significant concern.

Shekhawati Industries Ltd's latest results present a mixed picture. On one hand, the company reported a significant quarter-on-quarter increase in net profit, soaring to ₹4.63 crores, which is a remarkable 1007.84% increase compared to the previous quarter. Additionally, the operating margin improved dramatically to 53.44%, up from a negative margin in the same quarter last year, indicating strong cost management and operational efficiency.<BR><BR>However, the revenue figures tell a different story. The company recorded revenues of ₹8.14 crores for Q4 FY26, which represents a 25.73% decline year-on-year. This decline in revenue is concerning, especially given the extreme volatility in sales over recent quarters, with revenues fluctuating significantly.<BR><BR>While the profitability metrics are impressive, they are heavily reliant on cost-cutting measures and other income, raising questions about the sustainability of these earnings. The overall trend shows that while there has been a recovery in profitability, the underlying revenue challenges remain a significant concern.<BR><BR>In summary, the latest results can be seen as good in terms of profitability recovery, but the ongoing revenue decline and volatility cast doubt on the company's long-term stability and growth prospects.

View full answer

How has been the historical performance of Shekhawati Inds?

18-Oct-2025

Shekhawati Inds has experienced significant fluctuations, with net sales declining from INR 301.75 crore in March 2023 to INR 60.64 crore in March 2025, despite a recovery in operating profit and net income. The company's total assets and liabilities also decreased, raising concerns about its long-term sustainability.

Answer:<BR>The historical performance of Shekhawati Inds shows significant fluctuations in key financial metrics over the years.<BR><BR>Breakdown:<BR>Shekhawati Inds experienced a notable decline in net sales from INR 301.75 crore in March 2023 to INR 60.64 crore in March 2025, reflecting a downward trend in total operating income as well, which decreased from INR 363.26 crore in March 2022 to INR 60.64 crore in March 2025. The total expenditure also saw a reduction, dropping from INR 379.92 crore in March 2022 to INR 55.30 crore in March 2025. Operating profit, which was negative in previous years, turned positive at INR 7.12 crore in March 2025, indicating a recovery in operational efficiency. Profit before tax improved significantly from a loss of INR 21.18 crore in March 2023 to a profit of INR 6.27 crore in March 2025, and profit after tax followed suit, rising from a loss of INR 21.18 crore to a profit of INR 6.28 crore in the same period. The company's equity capital remained stable at INR 34.47 crore, while reserves improved from a negative INR 181.38 crore in March 2023 to negative INR 21.28 crore in March 2025. The total assets decreased from INR 108.25 crore in March 2023 to INR 38.10 crore in March 2025, and total liabilities also fell from INR 108.25 crore to INR 38.10 crore, indicating a reduction in financial obligations. Cash flow from operating activities was zero in March 2025, contrasting with positive cash flows in previous years, reflecting a challenging liquidity position. Overall, while Shekhawati Inds has shown signs of operational recovery, the significant drop in sales and assets raises concerns about its long-term sustainability.

View full answer

Is Shekhawati Inds overvalued or undervalued?

13-Oct-2025

As of October 10, 2025, Shekhawati Industries is considered a very attractive investment opportunity due to its undervaluation with a PE ratio of 10.26, strong financial metrics including a ROCE of 93.67%, and a PEG ratio of 0.05, despite a 46.32% decline in stock performance over the past year.

As of 10 October 2025, the valuation grade for Shekhawati Industries has moved from attractive to very attractive, indicating a stronger position in the market. The company is currently undervalued, with a PE ratio of 10.26, an EV to EBITDA of 11.66, and an impressive ROCE of 93.67%. In comparison to its peers, K P R Mill Ltd is considered very expensive with a PE ratio of 41.5, while Vardhman Textile, which is rated attractive, has a PE ratio of 13.63.<BR><BR>Despite recent stock performance showing a decline of 46.32% over the past year compared to a modest 1.09% increase in the Sensex, Shekhawati Industries' strong financial metrics suggest that it presents a compelling investment opportunity. The PEG ratio of 0.05 further emphasizes its undervaluation relative to growth potential, reinforcing the conclusion that Shekhawati Industries is a solid buy at its current price of 20.00.

View full answer

Who are the top shareholders of the Shekhawati Inds?

17-Jul-2025

The top shareholder of Shekhawati Industries is Mukesh Ramniranjan Ruia, holding 24.8%. Amax Network Pvt Ltd is the largest public shareholder at 3.23%, while individual investors collectively own 29.06% of the shares.

The top shareholders of Shekhawati Industries include the promoters, with Mukesh Ramniranjan Ruia holding the largest share at 24.8%. There are no pledged promoter holdings, and the company does not have any mutual funds or foreign institutional investors (FIIs) holding shares. The highest public shareholder is Amax Network Pvt Ltd, which holds 3.23%. Additionally, individual investors collectively hold 29.06% of the shares.

View full answer

What is the technical trend for Shekhawati Inds?

09-Jun-2025

As of May 29, 2025, Shekhawati Inds shows a mildly bearish trend, influenced by bearish daily moving averages and mixed signals from MACD and Bollinger Bands.

As of 29 May 2025, the technical trend for Shekhawati Inds has changed from sideways to mildly bearish. The weekly MACD indicates a mildly bullish stance, but the monthly MACD is mildly bearish, suggesting mixed signals. The daily moving averages are bearish, reinforcing the current negative outlook. The Bollinger Bands show a bearish trend on the weekly chart, while the monthly is mildly bullish, indicating some potential for recovery. The KST is bearish weekly but bullish monthly, adding to the complexity of the trend. Overall, the current technical stance is mildly bearish, driven primarily by the bearish daily moving averages and the mixed signals from MACD and Bollinger Bands.

View full answer

Has Shekhawati Inds declared dividend?

06-Jun-2025

No Dividend History Available

iScoreScore
Click here to find our call on this stock
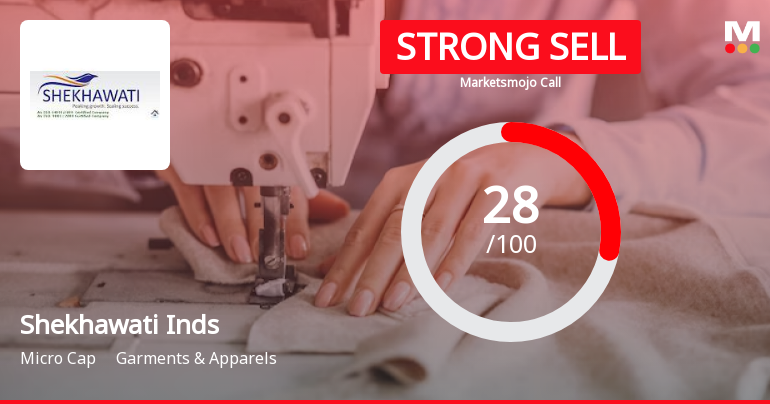
Strong Sell
Sell
Hold
Buy
Strong Buy

Dashboard

1

Weak Long Term Fundamental Strength with a -10.53% CAGR growth in Net Sales over the last 5 years

  • Low ability to service debt as the company has a high Debt to EBITDA ratio of 0.18 times
2

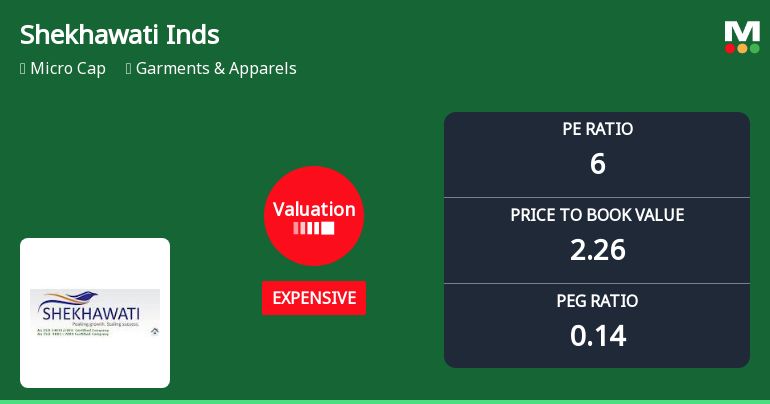
With ROE of 40, it has a Expensive valuation with a 2.3 Price to Book Value

3

Below par performance in long term as well as near term

stock-summaryMojo Parameters

Mojo Parameters

Loading Valuation Snapshot...

Stock DNA

stock-summary
Industry

Garments & Apparels

stock-summary
Market cap

INR 50 Cr (Micro Cap)

stock-summary
P/E

6.00

stock-summary
Industry P/E

25

stock-summary
Dividend Yield

0.00%

stock-summary
Debt Equity

-0.19

stock-summary
Return on Equity

40.02%

stock-summary
Price to Book

2.26

Revenue and Profits:
Net Sales:
8 Cr
(Quarterly Results - Mar 2026)
Net Profit:
5 Cr
stock-summaryTotal Returns
Total Returns (Price + Dividend) stock-summary
Dividend Yield (0%)
TimePeriod
Price Return
Dividend Return
Total Return
3 Months
-16.17%
0%
-16.17%
6 Months
-4.12%
0%
-4.12%
1 Year
-38.13%
0%
-38.13%
2 Years
-79.51%
0%
-79.51%
3 Years
0%
0%
0.0%
4 Years
0%
0%
0.0%
5 Years
0%
0%
0.0%

Shekhawati Inds for the last several years.

Risk Adjusted Returns v/s stock-summary
Returns Beta
Icon
Beta has not been calculated since enough price history is not available
stock-summaryNews & Corporate Actions

Announcements stock-summary

Shekhawati Poly-Yarn Limited - Other General Purpose

27-Nov-2019 | Source : NSE

Shekhawati Poly-Yarn Limited has submitted to the Exchange a copy of Disclosure of Related Party Transaction for the half year ended September 30, 2019 .

Shekhawati Poly-Yarn Limited - Outcome of Board Meeting

15-Nov-2019 | Source : NSE

Shekhawati Poly-Yarn Limited has informed the Exchange regarding Board meeting held on November 14, 2019.

Reply to Clarification Sought

09-Sep-2019 | Source : NSE

SPYL:The Exchange had sought clarification from Shekhawati Poly-Yarn Limited with respect to announcement dated 17-Aug-2019, regarding Resignation of Ms Swati Sahukara as Independent Director of the company w.e.f. August 12, 2019. On basis of above the Company was required to clarify following: 1. No other material reasons other than providedThe response of the Company is attached.

Corporate Actions stock-summary

stock-summary
BOARD MEETING

12 Aug 2026

stock-summary
DIVIDEND

No Dividend history available

stock-summary
SPLITS

Shekhawati Industries Ltd has announced 10:1 stock split, ex-date: 28 Aug 24

stock-summary
BONUS

No Bonus history available

stock-summary
RIGHTS

No Rights history available

stock-summaryKey Factors

Quality key factors stock-summary

Factor
Value
Sales Growth (5y)
-10.53%
EBIT Growth (5y)
20.48%
EBIT to Interest (avg)
-7.79
Debt to EBITDA (avg)
Negative Net Debt
Net Debt to Equity (avg)
-0.19
Sales to Capital Employed (avg)
-0.93
Tax Ratio
0
Dividend Payout Ratio
0
Pledged Shares
0
Institutional Holding
0
ROCE (avg)
102.54%
ROE (avg)
62.95%

Valuation key factors

Factor
Value
P/E Ratio
6
Industry P/E
52
Price to Book Value
2.26
EV to EBIT
6.78
EV to EBITDA
5.82
EV to Capital Employed
2.55
EV to Sales
2.78
PEG Ratio
0.14
Dividend Yield
NA
ROCE (Latest)
37.61%
ROE (Latest)
40.02%

Technicals key factors

Indicator
Weekly
Monthly
MACD
Mildly Bullish
Bearish
RSI
No Signal
Bearish
Bollinger Bands
Bullish
Mildly Bearish
Moving Averages
Mildly Bearish (Daily)
KST
Bearish
Bearish
Dow Theory
Mildly Bullish
No Trend
OBV
Mildly Bearish
No Trend
stock-summary Technical Indicator Scale: Bearish, Mildly Bearish, Sideways, Mildly Bullish, Bullish  Turned 
stock-summaryShareholding
Shareholding Snapshot : Jun 2026stock-summary
Shareholding Compare (%holding) stock-summary
Majority shareholders

Promoters

Pledged Promoter Holdings

None

Mutual Funds

Held by 0 Schemes

FIIs

Held by 0 FIIs

Promoter with highest holding

Mukesh Ramniranjan Ruia (22.92%)

Highest Public shareholder

Amax Network Pvt Ltd (3.21%)

Individual Investors Holdings

29.15%

stock-summaryFinancial
[
  {
    "link": "quarterly",
    "btn_text": "All Quarterly Results",
    "header": "Quarterly Results Snapshot (Standalone) - Mar'26 - QoQ",
    "rhs": [
      {
        "prefix": "Net Sales ",
        "suffix": "QoQ Growth in quarter ended Mar 2026 is 282.16% vs -29.00% in Dec 2025",
        "dir": 1
      },
      {
        "prefix": "Standalone Net Profit ",
        "suffix": "QoQ Growth in quarter ended Mar 2026 is 1,007.84% vs -127.27% in Dec 2025",
        "dir": 1
      }
    ],
    "table": {
      "header": [
        "Mar'26",
        "Dec'25",
        "Change(%)"
      ],
      "body": [
        {
          "field": "Net Sales",
          "val1": "8.14",
          "val2": "2.13",
          "chgp": "282.16%",
          "chgp_class": "positive"
        },
        {
          "field": "Operating Profit (PBDIT) excl Other Income",
          "val1": "4.35",
          "val2": "-0.20",
          "chgp": "2,275.00%",
          "chgp_class": "positive"
        },
        {
          "field": "Interest",
          "val1": "0.04",
          "val2": "0.04",
          "chgp": "",
          "chgp_class": "neutral"
        },
        {
          "field": "Exceptional Items",
          "val1": "0.00",
          "val2": "0.00",
          "chgp": "",
          "chgp_class": "neutral"
        },
        {
          "field": "Standalone Net Profit",
          "val1": "4.63",
          "val2": "-0.51",
          "chgp": "1,007.84%",
          "chgp_class": "positive"
        },
        {
          "field": "Operating Profit Margin (Excl OI)",
          "val1": "53.44%",
          "val2": "-9.39%",
          "chgp": "62.83%",
          "chgp_class": "positive"
        }
      ]
    }
  },
  {
    "link": "half-yearly",
    "btn_text": "All Half Yearly Results",
    "header": "Half Yearly Results Snapshot (Standalone) - Sep'25",
    "rhs": [
      {
        "prefix": "Net Sales ",
        "suffix": " Growth in half year ended Sep 2025 is -82.55% vs 12.83% in Sep 2024",
        "dir": -1
      },
      {
        "prefix": "Standalone Net Profit ",
        "suffix": " Growth in half year ended Sep 2025 is -4.67% vs -20.90% in Sep 2024",
        "dir": 1
      }
    ],
    "table": {
      "header": [
        "Sep'25",
        "Sep'24",
        "Change(%)"
      ],
      "body": [
        {
          "field": "Net Sales",
          "val1": "6.00",
          "val2": "34.39",
          "chgp": "-82.55%",
          "chgp_class": "negative"
        },
        {
          "field": "Operating Profit (PBDIT) excl Other Income",
          "val1": "3.71",
          "val2": "4.00",
          "chgp": "-7.25%",
          "chgp_class": "negative"
        },
        {
          "field": "Interest",
          "val1": "0.01",
          "val2": "0.02",
          "chgp": "-50.00%",
          "chgp_class": "positive"
        },
        {
          "field": "Exceptional Items",
          "val1": "0.00",
          "val2": "0.00",
          "chgp": "",
          "chgp_class": "neutral"
        },
        {
          "field": "Standalone Net Profit",
          "val1": "4.69",
          "val2": "4.92",
          "chgp": "-4.67%",
          "chgp_class": "negative"
        },
        {
          "field": "Operating Profit Margin (Excl OI)",
          "val1": "61.83%",
          "val2": "11.63%",
          "chgp": "50.20%",
          "chgp_class": "positive"
        }
      ]
    }
  },
  {
    "link": "nine-monthly",
    "btn_text": "All Nine Monthly Results",
    "header": "Nine Monthly Results Snapshot (Standalone) - Dec'25",
    "rhs": [
      {
        "prefix": "Net Sales ",
        "suffix": "YoY Growth in nine months ended Dec 2025 is -83.63% vs 13.93% in Dec 2024",
        "dir": -1
      },
      {
        "prefix": "Standalone Net Profit ",
        "suffix": "YoY Growth in nine months ended Dec 2025 is -34.99% vs -25.06% in Dec 2024",
        "dir": -1
      }
    ],
    "table": {
      "header": [
        "Dec'25",
        "Dec'24",
        "Change(%)"
      ],
      "body": [
        {
          "field": "Net Sales",
          "val1": "8.13",
          "val2": "49.66",
          "chgp": "-83.63%",
          "chgp_class": "negative"
        },
        {
          "field": "Operating Profit (PBDIT) excl Other Income",
          "val1": "3.51",
          "val2": "5.35",
          "chgp": "-34.39%",
          "chgp_class": "negative"
        },
        {
          "field": "Interest",
          "val1": "0.05",
          "val2": "0.03",
          "chgp": "66.67%",
          "chgp_class": "negative"
        },
        {
          "field": "Exceptional Items",
          "val1": "0.00",
          "val2": "0.00",
          "chgp": "",
          "chgp_class": "neutral"
        },
        {
          "field": "Standalone Net Profit",
          "val1": "4.18",
          "val2": "6.43",
          "chgp": "-34.99%",
          "chgp_class": "negative"
        },
        {
          "field": "Operating Profit Margin (Excl OI)",
          "val1": "43.12%",
          "val2": "10.77%",
          "chgp": "32.35%",
          "chgp_class": "positive"
        }
      ]
    }
  },
  {
    "link": "annual",
    "btn_text": "All Annual Results",
    "header": "Annual Results Snapshot (Standalone) - Mar'26",
    "rhs": [
      {
        "prefix": "Net Sales ",
        "suffix": "YoY Growth in year ended Mar 2026 is -73.16% vs -21.03% in Mar 2025",
        "dir": -1
      },
      {
        "prefix": "Standalone Net Profit ",
        "suffix": "YoY Growth in year ended Mar 2026 is 40.29% vs -95.92% in Mar 2025",
        "dir": 1
      }
    ],
    "table": {
      "header": [
        "Mar'26",
        "Mar'25",
        "Change(%)"
      ],
      "body": [
        {
          "field": "Net Sales",
          "val1": "16.27",
          "val2": "60.61",
          "chgp": "-73.16%",
          "chgp_class": "negative"
        },
        {
          "field": "Operating Profit (PBDIT) excl Other Income",
          "val1": "8.32",
          "val2": "5.33",
          "chgp": "56.10%",
          "chgp_class": "positive"
        },
        {
          "field": "Interest",
          "val1": "0.10",
          "val2": "0.04",
          "chgp": "150.00%",
          "chgp_class": "negative"
        },
        {
          "field": "Exceptional Items",
          "val1": "0.00",
          "val2": "0.00",
          "chgp": "",
          "chgp_class": "neutral"
        },
        {
          "field": "Standalone Net Profit",
          "val1": "8.81",
          "val2": "6.28",
          "chgp": "40.29%",
          "chgp_class": "positive"
        },
        {
          "field": "Operating Profit Margin (Excl OI)",
          "val1": "51.14%",
          "val2": "8.79%",
          "chgp": "42.35%",
          "chgp_class": "positive"
        }
      ]
    }
  }
]

Quarterly Results Snapshot (Standalone) - Mar'26 - QoQstock-summary

Mar'26
Dec'25
Change(%)
Net Sales
8.14
2.13
282.16%
Operating Profit (PBDIT) excl Other Income
4.35
-0.20
2,275.00%
Interest
0.04
0.04
Exceptional Items
0.00
0.00
Standalone Net Profit
4.63
-0.51
1,007.84%
Operating Profit Margin (Excl OI)
53.44%
-9.39%
62.83%
Values in Rs Cr.
Direction Arrows
Net Sales

QoQ Growth in quarter ended Mar 2026 is 282.16% vs -29.00% in Dec 2025

Direction Arrows
Standalone Net Profit

QoQ Growth in quarter ended Mar 2026 is 1,007.84% vs -127.27% in Dec 2025

Half Yearly Results Snapshot (Standalone) - Sep'25stock-summary

Sep'25
Sep'24
Change(%)
Net Sales
6.00
34.39
-82.55%
Operating Profit (PBDIT) excl Other Income
3.71
4.00
-7.25%
Interest
0.01
0.02
-50.00%
Exceptional Items
0.00
0.00
Standalone Net Profit
4.69
4.92
-4.67%
Operating Profit Margin (Excl OI)
61.83%
11.63%
50.20%
Values in Rs Cr.
Direction Arrows
Net Sales

Growth in half year ended Sep 2025 is -82.55% vs 12.83% in Sep 2024

Direction Arrows
Standalone Net Profit

Growth in half year ended Sep 2025 is -4.67% vs -20.90% in Sep 2024

Nine Monthly Results Snapshot (Standalone) - Dec'25stock-summary

Dec'25
Dec'24
Change(%)
Net Sales
8.13
49.66
-83.63%
Operating Profit (PBDIT) excl Other Income
3.51
5.35
-34.39%
Interest
0.05
0.03
66.67%
Exceptional Items
0.00
0.00
Standalone Net Profit
4.18
6.43
-34.99%
Operating Profit Margin (Excl OI)
43.12%
10.77%
32.35%
Values in Rs Cr.
Direction Arrows
Net Sales

YoY Growth in nine months ended Dec 2025 is -83.63% vs 13.93% in Dec 2024

Direction Arrows
Standalone Net Profit

YoY Growth in nine months ended Dec 2025 is -34.99% vs -25.06% in Dec 2024

Annual Results Snapshot (Standalone) - Mar'26stock-summary

Mar'26
Mar'25
Change(%)
Net Sales
16.27
60.61
-73.16%
Operating Profit (PBDIT) excl Other Income
8.32
5.33
56.10%
Interest
0.10
0.04
150.00%
Exceptional Items
0.00
0.00
Standalone Net Profit
8.81
6.28
40.29%
Operating Profit Margin (Excl OI)
51.14%
8.79%
42.35%
Values in Rs Cr.
Direction Arrows
Net Sales

YoY Growth in year ended Mar 2026 is -73.16% vs -21.03% in Mar 2025

Direction Arrows
Standalone Net Profit

YoY Growth in year ended Mar 2026 is 40.29% vs -95.92% in Mar 2025

stock-summaryCompany CV
About Shekhawati Industries Ltd stock-summary
stock-summary
Shekhawati Industries Ltd
Micro Cap
Garments & Apparels
Shekhawati Industries Limited was initially incorporated as a Private limited company as 'Shekhawati Poly-Yarn Private Limited' on November 5, 1990. Company was converted into a public limited company and the name of the Company was changed to Shekhawati Poly-Yarn Limited in April 2010. Company further changed the name to Shekhawati Industries Limited effective on July 23, 2024.
Company Coordinates stock-summary
Company Details
Plot No 185/1 Naroli Village, Near Kanadi Phatak Silvassa Dadra & Nagar Haveli (U T) : 396235
stock-summary
Tel: 91-260-2650666
stock-summary
unit3@shekhawatiyarn.com
Registrar Details
Sharex Dynamic (India) Pvt Ltd , Unit -1, Luthra Ind. Premises , Safed Pool, Andheri-Kurla Road, Andheri (E), Mumbai