SIL Investments

  • Market Cap: Micro Cap
  • Industry: Holding Company
  • ISIN: INE923A01015
  • NSEID: SILINV
  • BSEID: 521194
INR
452.35
9.35 (2.11%)
BSENSE

Sep 22, 10:12 AM

BSE+NSE Vol: 51

  • Price Points
  • Score
  • Mojo Parameters
  • Total Return
  • News and Corporate Actions
  • Key factors
  • Shareholding
  • Financials
  • CompanyCV
stock-summaryPrice Point
High/Low

1Day

52 Week

Valuation
Technical
Day's Volume

CASH

51 (-94.09%) Volume

Shareholding (Jun 2026)

FII

0.09%

Held by 1 FIIs

DII

0.02%

Held by 0 DIIs

Promoter

63.79%

Why is SIL Investments Ltd falling/rising?

06-Sep-2026

As of 05-Sep, SIL Investments Ltd's stock price is declining at 472.35, down -0.93%. This decline is due to underperformance against its sector, trading below moving averages, decreased investor participation, and negative year-to-date performance.

As of 05-Sep, SIL Investments Ltd is experiencing a decline in its stock price, currently at 472.35, which reflects a change of -4.45 (-0.93%). This downward movement can be attributed to several factors. <BR><BR>Firstly, the stock has underperformed significantly compared to its sector, with a performance today that is -101.08% lower than the sector average. Additionally, the stock has been trading below its moving averages across various time frames, including the 5-day, 20-day, 50-day, 100-day, and 200-day averages, indicating a bearish trend.<BR><BR>Moreover, there has been a notable decrease in investor participation, as evidenced by a delivery volume of 741 on September 3, which is down by -66.06% compared to the 5-day average delivery volume. This decline in trading activity suggests a lack of interest from investors, further contributing to the stock's falling price.<BR><BR>In the broader context, while the stock has shown some positive performance over the past month with a gain of +12.38%, its year-to-date performance remains negative at -8.25%, and it has also declined by -19.94% over the past year. These trends indicate ongoing challenges for SIL Investments Ltd, leading to its current price decline.

View full answer

Who are in the management team of SIL Investments?

01-Sep-2026

The management team of SIL Investments includes C S Nopany (Chairman), Shalini Nopany (Managing Director), and several non-executive and independent directors, including Sanjay Goenka, Abhrajit Dutta, and Shrikant Mantri, along with Lokesh Gandhi as Company Secretary. They are responsible for guiding the company's strategy and ensuring regulatory compliance.

The management team of SIL Investments includes the following individuals:<BR><BR>1. **C S Nopany** - Chairman (Non-Executive)<BR>2. **Sanjay Goenka** - Non-Executive & Independent Director<BR>3. **Shalini Nopany** - Managing Director<BR>4. **Lokesh Gandhi** - Company Secretary & Compliance Officer<BR>5. **Brij Mohan Agarwal** - Director (Incharge)<BR>6. **Abhrajit Dutta** - Non-Executive & Independent Director<BR>7. **Shrikant Mantri** - Non-Executive & Independent Director<BR><BR>This team plays a crucial role in guiding the company's strategic direction and ensuring compliance with regulations.

View full answer

What does SIL Investments do?

01-Sep-2026

SIL Investments Ltd is a micro-cap holding company, originally incorporated in 1934, that focuses on investments following the demerger of its textiles division in 2006-07. As of June 2026, it reported net sales of 24 Cr and a net profit of 20 Cr, with a market cap of INR 535 Cr.

Overview: <BR>SIL Investments Ltd is a holding company operating in the micro-cap category.<BR><BR>History: <BR>Incorporated in November 1934, originally as Sutlej Cotton Mills Limited, the company was renamed Sutlej Industries Limited until 2005. In 2006-07, the textiles division was demerged into a new company called Sutlej Textiles And Industries Limited. The latest quarterly results reported net sales and net profit for June 2026.<BR><BR>Financial Snapshot: <BR>Net Sales: 24 Cr (Quarterly Results - Jun 2026) <BR>Net Profit: 20 Cr (Quarterly Results - Jun 2026) <BR>Market Cap: INR 535 Cr (Micro Cap)<BR><BR>Key Metrics: <BR>P/E: 10.00 <BR>Industry P/E: 21 <BR>Dividend Yield: 0.51% <BR>Debt Equity: 0.00 <BR>Return on Equity: 1.47% <BR>Price to Book: 0.20<BR><BR>Contact Details: <BR>Address: Pachpahar Road, Bhawanimandi Rajasthan: 326502 <BR>Tel: 91-7433-222052/82/90/222115 <BR>Email: cs@silinvestments.in/hoffice@sutlej <BR>Website: http://www.silinvestments.in

View full answer

Who are the peers of the SIL Investments?

01-Sep-2026

Peers of SIL Investments include Rane Holdings, Elcid Investment, BF Investment, Abans Financial, Dhunseri Invest., GFL, Nisus Finance, Tamboli Industri, and BIL Vyapar. SIL Investments has a 1-year return of -13.07%, with Tamboli Industri leading at 68.39% and Nisus Finance at -51.59%.

Peers: The peers of SIL Investments are Rane Holdings, Elcid Investment, BF Investment, Abans Financial, Dhunseri Invest., GFL, Nisus Finance, Tamboli Industri, and BIL Vyapar.<BR><BR>Quality Snapshot: Excellent management risk is observed at BF Investment, Abans Financial, and Nisus Finance, while Average management risk is found at Nisus Finance and the rest. Below Average management risk is noted at Rane Holdings, Elcid Investment, Dhunseri Invest., GFL, Tamboli Industri, and the rest. Growth is Excellent for BF Investment, Abans Financial, and Nisus Finance, while Good growth is seen at SIL Investments, and the rest have Below Average growth. Capital Structure is Excellent for Rane Holdings, Elcid Investment, BF Investment, Abans Financial, Dhunseri Invest., Tamboli Industri, and the rest, while GFL has Below Average capital structure.<BR><BR>Return Snapshot: The peer with the highest 1-year return is Tamboli Industri at 68.39%, while the lowest is Nisus Finance at -51.59%. SIL Investments has a 1-year return of -13.07%, which is higher than Nisus Finance but lower than Tamboli Industri. Additionally, GFL and BIL Vyapar have negative six-month returns.

View full answer

How big is SIL Investments?

01-Sep-2026

As of 31st August, SIL Investments Ltd has a market capitalization of 535.00 Cr, with Net Sales of 73.76 Cr and a Net Profit of 50.12 Cr reported in the latest four quarters. The company has Shareholder's Funds of 2,564.63 Cr and Total Assets of 2,857.22 Cr as of March 2026.

As of 31st August, SIL Investments Ltd has a market capitalization of 535.00 Cr, categorizing it as a Micro Cap company.<BR><BR>In the latest four quarters, SIL Investments reported Net Sales of 73.76 Cr and a Net Profit of 50.12 Cr.<BR><BR>For the reporting period of March 2026, the company had Shareholder's Funds amounting to 2,564.63 Cr and Total Assets of 2,857.22 Cr.

View full answer

Should I buy, sell or hold SIL Investments Ltd?

15-Aug-2026

Are SIL Investments Ltd latest results good or bad?

13-Aug-2026

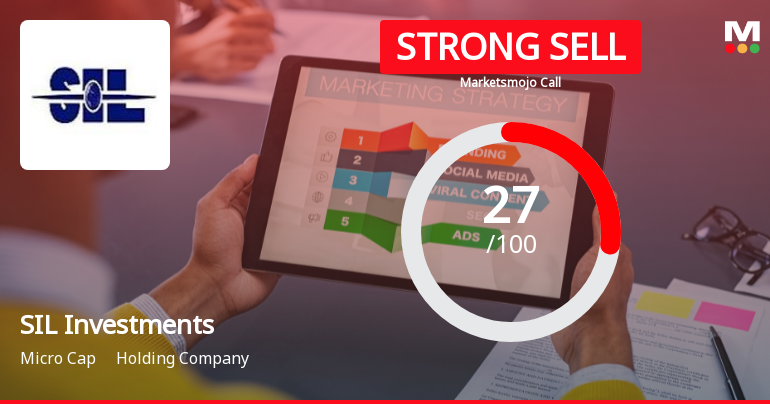
SIL Investments Ltd's latest results are concerning, showing a net loss of ₹9.10 crores in Q4 FY26 and negative revenue of ₹5.64 crores, reflecting significant operational challenges. The stock has underperformed with a 31.31% decline over the past year, leading to a "STRONG SELL" recommendation from analysts.

The latest results for SIL Investments Ltd are quite concerning. In Q4 FY26, the company reported a net loss of ₹9.10 crores, which represents a staggering 238.29% decline year-on-year. Additionally, the revenue for the same quarter was negative at ₹5.64 crores, marking a drastic 1072.41% drop compared to the previous year. This unprecedented negative revenue suggests significant operational challenges and potential disruptions in the company's business model.<BR><BR>Moreover, the stock has underperformed severely, declining 31.31% over the past year compared to the Sensex's 8.30% decline. The market's reaction reflects deep skepticism regarding the company's near-term prospects, with advisory ratings indicating a "STRONG SELL" recommendation.<BR><BR>While SIL Investments does maintain a robust balance sheet with zero long-term debt and a substantial investment portfolio, the operational metrics reveal a troubling picture. The company is struggling to generate adequate returns, as evidenced by a low return on equity of just 1.34%. Given these factors, the overall assessment of the latest results is decidedly negative, indicating significant challenges ahead for SIL Investments.

View full answer

When is the next results date for SIL Investments Ltd?

29-Apr-2026

The next results date for SIL Investments Ltd is 12 May 2026.

The next results date for SIL Investments Ltd is scheduled for 12 May 2026.

View full answer

Is SIL Investments technically bullish or bearish?

04-Dec-2025

As of December 3, 2025, SIL Investments is in a mildly bearish trend, indicated by bearish weekly MACD and Bollinger Bands, despite a mildly bullish daily moving average, and has underperformed compared to the Sensex over the past month and year.

As of 3 December 2025, the technical trend has changed from sideways to mildly bearish. The current technical stance for SIL Investments is mildly bearish. Key indicators driving this stance include the weekly MACD and Bollinger Bands both indicating bearish conditions, while the monthly MACD is mildly bearish. The Dow Theory also reflects a mildly bearish outlook on both weekly and monthly time frames. Although the daily moving averages show a mildly bullish signal, the overall sentiment is tempered by the broader bearish indicators. The stock has underperformed significantly over the past month and year compared to the Sensex, further supporting the bearish outlook.

View full answer

How has been the historical performance of SIL Investments?

03-Dec-2025

SIL Investments has shown steady growth in net sales and profitability, with net sales reaching 54.82 Cr and profit after tax at 31.29 Cr as of March 2025. The company has also demonstrated significant asset growth, maintaining a debt-free status.

Answer:<BR>The historical performance of SIL Investments shows a steady growth in net sales and profitability over the years, with the latest figures for March 2025 indicating net sales of 54.82 Cr and a profit after tax of 31.29 Cr.<BR><BR>Breakdown:<BR>SIL Investments has demonstrated a consistent increase in net sales from 25.69 Cr in March 2019 to 54.82 Cr in March 2025, with a notable rise from 50.96 Cr in March 2024. The total operating income followed a similar trend, reaching 54.82 Cr in March 2025. Operating profit (PBDIT) also saw growth, climbing to 44.46 Cr in March 2025 from 25.17 Cr in March 2019. Profit before tax increased to 41.89 Cr in March 2025, while profit after tax reached 31.29 Cr, reflecting a robust performance despite fluctuations in previous years. The company's total assets rose significantly to 3,538.75 Cr in March 2025, up from 760.90 Cr in March 2020, indicating strong asset growth. Additionally, total liabilities increased to 3,538.75 Cr in March 2025, with no long-term or short-term borrowings reported, showcasing a debt-free status. Cash flow from operating activities decreased to 9.00 Cr in March 2025, while the closing cash and cash equivalents stood at 13.00 Cr, down from 20.00 Cr in March 2024. Overall, SIL Investments has shown a positive trajectory in its financial performance over the years.

View full answer

Who are the top shareholders of the SIL Investments?

17-Jul-2025

The top shareholders of SIL Investments are Ganges Securities Limited with 19.06%, Birla Institute of Technology and Science at 7.1%, and individual investors holding 16.84%. There are no pledged promoter holdings or mutual funds invested in the company.

The top shareholders of SIL Investments include Ganges Securities Limited, which holds the highest stake at 19.06%. Other significant shareholders are the Birla Institute of Technology and Science, with a holding of 7.1%, and individual investors collectively holding 16.84%. Additionally, there is one foreign institutional investor (FII) that holds 0.09% of the shares. Notably, there are no pledged promoter holdings and no mutual funds currently invested in the company.

View full answer

Is SIL Investments overvalued or undervalued?

09-Jun-2025

As of February 1, 2024, SIL Investments is considered overvalued with a PE ratio of 20.39, an EV to EBITDA of 12.85, and a PEG ratio of 1.71, showing mixed stock performance with a 1-year return of 28.15% but a year-to-date decline of 9.43%.

As of 1 February 2024, SIL Investments has moved from an attractive to a very expensive valuation grade. The company is currently considered overvalued. Key ratios include a PE ratio of 20.39, an EV to EBITDA of 12.85, and a PEG ratio of 1.71, which indicate that the stock is priced high relative to its earnings growth potential.<BR><BR>In comparison to its peers, SIL Investments' PE ratio is significantly higher than Life Insurance, which has a PE of 12.54 and is rated fair, while Bajaj Finance is also categorized as very expensive with a PE of 35.01. The company's recent stock performance has been mixed, showing a 1-year return of 28.15%, which outperforms the Sensex's 7.62% but has underperformed in the year-to-date comparison with a decline of 9.43% against the Sensex's 5.63%.

View full answer

Has SIL Investments declared dividend?

06-Jun-2025

Yes, SIL Investments Ltd has declared a 25% dividend, amounting to ₹2.5 per share, with an ex-date of July 23, 2024. While short-term returns have been negative, the company has shown significant growth over the longer term, particularly a total return of 444.46% over the past 5 years.

SIL Investments Ltd has declared a 25% dividend.<BR><BR>Dividend Details:<BR>- Percentage announced: 25%<BR>- Amount per share: 2.5<BR>- Ex-date: 23 Jul 24<BR><BR>Dividend Yield: 0.41%.<BR><BR>Total Returns by Period:<BR>In the last 6 months, the price return was -13.84%, with a dividend return of 0%, resulting in a total return of -13.84%.<BR><BR>Over the past year, the price return was 28.92%, with a dividend return of 0.53%, leading to a total return of 29.45%.<BR><BR>In the 2-year period, the price return was 98.5%, the dividend return was 1.51%, culminating in a total return of 100.01%.<BR><BR>For the last 3 years, the price return was 98.72%, with a dividend return of 2.65%, resulting in a total return of 101.37%.<BR><BR>In the 4-year period, the price return was 159.68%, the dividend return was 3.61%, leading to a total return of 163.29%.<BR><BR>Over the last 5 years, the price return was 435.51%, with a dividend return of 8.95%, resulting in a total return of 444.46%.<BR><BR>Overall, SIL Investments has recently declared a dividend, and while the short-term returns have been negative, the longer-term returns demonstrate significant growth, particularly over the 5-year period.

View full answer
iScoreScore
Click here to find our call on this stock
Strong Sell
Sell
Hold
Buy
Strong Buy

Dashboard

1

Weak Long Term Fundamental Strength with an average Return on Equity (ROE) of 1.41%

 
2

With ROE of 1.5, it has a Very Expensive valuation with a 0.2 Price to Book Value

stock-summaryMojo Parameters

Mojo Parameters

Loading Valuation Snapshot...

Stock DNA

stock-summary
Industry

Holding Company

stock-summary
Market cap

INR 477 Cr (Micro Cap)

stock-summary
P/E

10.00

stock-summary
Industry P/E

52

stock-summary
Dividend Yield

0.55%

stock-summary
Debt Equity

0.00

stock-summary
Return on Equity

1.47%

stock-summary
Price to Book

0.19

Revenue and Profits:
Net Sales:
24 Cr
(Quarterly Results - Jun 2026)
Net Profit:
20 Cr
stock-summaryTotal Returns
Total Returns (Price + Dividend) stock-summary
Dividend Yield (0.55%)
TimePeriod
Price Return
Dividend Return
Total Return
3 Months
5.85%
0.59%
6.44%
6 Months
12.41%
0.64%
13.05%
1 Year
-23.79%
0.41%
-23.38%
2 Years
-19.71%
0.84%
-18.87%
3 Years
37.39%
2.34%
39.73%
4 Years
38.61%
3.15%
41.76%
5 Years
68.79%
3.77%
72.56%

Latest dividend: 2.5 per share ex-dividend date: Jul-24-2026

Risk Adjusted Returns v/s stock-summary
Returns Beta
Icon
Beta has not been calculated since enough price history is not available
stock-summaryNews & Corporate Actions

News

Announcements stock-summary

SIL Investments Limited - Updates

05-Dec-2019 | Source : NSE

SIL Investments Limited has informed the Exchange regarding 'Disclosure under Regulation 23(9) of SEBI (Listing Obligations and Disclosure Requirements) (Amendments), Regulations, 2018 '.

Shareholders meeting

17-Sep-2019 | Source : NSE

SIL Investments Limited has informed the Exchange with copy of minutes of Annual General Meeting held on August 22, 2019

Updates

16-Sep-2019 | Source : NSE

SIL Investments Limited has informed the Exchange regarding 'Minutes of 85th Annual General Meeting of the Company held on 22nd August, 2019'.

Corporate Actions stock-summary

stock-summary
BOARD MEETING

No Upcoming Board Meetings

stock-summary
DIVIDEND

SIL Investments Ltd has declared 25% dividend, ex-date: 24 Jul 26

stock-summary
SPLITS

No Splits history available

stock-summary
BONUS

No Bonus history available

stock-summary
RIGHTS

No Rights history available

stock-summaryKey Factors

Quality key factors stock-summary

Factor
Value
Sales Growth (5y)
22.42%
EBIT Growth (5y)
19.80%
Net Debt to Equity (avg)
0
Institutional Holding
0.11%
ROE (avg)
1.41%

Valuation key factors

Factor
Value
P/E Ratio
10
Industry P/E
52
Price to Book Value
0.19
EV to EBIT
7.64
EV to EBITDA
7.30
EV to Capital Employed
0.18
EV to Sales
6.27
PEG Ratio
0.23
Dividend Yield
0.55%
ROCE (Latest)
1.94%
ROE (Latest)
1.47%

Technicals key factors

Indicator
Weekly
Monthly
MACD
Mildly Bullish
Bearish
RSI
No Signal
No Signal
Bollinger Bands
Bullish
Bearish
Moving Averages
Mildly Bearish (Daily)
KST
Bullish
Bearish
Dow Theory
No Trend
No Trend
OBV
No Trend
No Trend
stock-summary Technical Indicator Scale: Bearish, Mildly Bearish, Sideways, Mildly Bullish, Bullish  Turned 
stock-summaryShareholding
Shareholding Snapshot : Jun 2026stock-summary
Shareholding Compare (%holding) stock-summary
Majority shareholders

Promoters

Pledged Promoter Holdings

None

Mutual Funds

Held by 0 Schemes

FIIs

Held by 1 FIIs (0.09%)

Promoter with highest holding

Ganges Securities Limited (19.06%)

Highest Public shareholder

Birla Institute Of Technology And Science (7.1%)

Individual Investors Holdings

16.28%

stock-summaryFinancial
[
  {
    "link": "quarterly",
    "btn_text": "All Quarterly Results",
    "header": "Quarterly Results Snapshot (Consolidated) - Jun'26 - YoY",
    "rhs": [
      {
        "prefix": "Net Sales ",
        "suffix": "YoY Growth in quarter ended Jun 2026 is 87.35% vs 75.80% in Jun 2025",
        "dir": 1
      },
      {
        "prefix": "Consolidated Net Profit ",
        "suffix": "YoY Growth in quarter ended Jun 2026 is 155.30% vs 127.59% in Jun 2025",
        "dir": 1
      }
    ],
    "table": {
      "header": [
        "Jun'26",
        "Jun'25",
        "Change(%)"
      ],
      "body": [
        {
          "field": "Net Sales",
          "val1": "23.55",
          "val2": "12.57",
          "chgp": "87.35%",
          "chgp_class": "positive"
        },
        {
          "field": "Operating Profit (PBDIT) excl Other Income",
          "val1": "21.35",
          "val2": "10.09",
          "chgp": "111.60%",
          "chgp_class": "positive"
        },
        {
          "field": "Interest",
          "val1": "0.00",
          "val2": "0.01",
          "chgp": "-100.00%",
          "chgp_class": "positive"
        },
        {
          "field": "Exceptional Items",
          "val1": "0.00",
          "val2": "0.00",
          "chgp": "",
          "chgp_class": "neutral"
        },
        {
          "field": "Consolidate Net Profit",
          "val1": "20.22",
          "val2": "7.92",
          "chgp": "155.30%",
          "chgp_class": "positive"
        },
        {
          "field": "Operating Profit Margin (Excl OI)",
          "val1": "90.66%",
          "val2": "80.27%",
          "chgp": "10.39%",
          "chgp_class": "positive"
        }
      ]
    }
  },
  {
    "link": "half-yearly",
    "btn_text": "All Half Yearly Results",
    "header": "Half Yearly Results Snapshot (Consolidated) - Sep'25",
    "rhs": [
      {
        "prefix": "Net Sales ",
        "suffix": " Growth in half year ended Sep 2025 is 29.26% vs 32.00% in Sep 2024",
        "dir": -1
      },
      {
        "prefix": "Consolidated Net Profit ",
        "suffix": " Growth in half year ended Sep 2025 is 38.62% vs 36.90% in Sep 2024",
        "dir": 1
      }
    ],
    "table": {
      "header": [
        "Sep'25",
        "Sep'24",
        "Change(%)"
      ],
      "body": [
        {
          "field": "Net Sales",
          "val1": "41.22",
          "val2": "31.89",
          "chgp": "29.26%",
          "chgp_class": "positive"
        },
        {
          "field": "Operating Profit (PBDIT) excl Other Income",
          "val1": "36.19",
          "val2": "26.87",
          "chgp": "34.69%",
          "chgp_class": "positive"
        },
        {
          "field": "Interest",
          "val1": "0.00",
          "val2": "0.00",
          "chgp": "",
          "chgp_class": "neutral"
        },
        {
          "field": "Exceptional Items",
          "val1": "0.00",
          "val2": "0.00",
          "chgp": "",
          "chgp_class": "neutral"
        },
        {
          "field": "Consolidate Net Profit",
          "val1": "27.46",
          "val2": "19.81",
          "chgp": "38.62%",
          "chgp_class": "positive"
        },
        {
          "field": "Operating Profit Margin (Excl OI)",
          "val1": "87.80%",
          "val2": "84.26%",
          "chgp": "3.54%",
          "chgp_class": "positive"
        }
      ]
    }
  },
  {
    "link": "nine-monthly",
    "btn_text": "All Nine Monthly Results",
    "header": "Nine Monthly Results Snapshot (Consolidated) - Dec'25",
    "rhs": [
      {
        "prefix": "Net Sales ",
        "suffix": "YoY Growth in nine months ended Dec 2025 is 26.14% vs 19.60% in Dec 2024",
        "dir": 1
      },
      {
        "prefix": "Consolidated Net Profit ",
        "suffix": "YoY Growth in nine months ended Dec 2025 is 39.56% vs 31.17% in Dec 2024",
        "dir": 1
      }
    ],
    "table": {
      "header": [
        "Dec'25",
        "Dec'24",
        "Change(%)"
      ],
      "body": [
        {
          "field": "Net Sales",
          "val1": "68.42",
          "val2": "54.24",
          "chgp": "26.14%",
          "chgp_class": "positive"
        },
        {
          "field": "Operating Profit (PBDIT) excl Other Income",
          "val1": "61.04",
          "val2": "44.87",
          "chgp": "36.04%",
          "chgp_class": "positive"
        },
        {
          "field": "Interest",
          "val1": "0.00",
          "val2": "0.00",
          "chgp": "",
          "chgp_class": "neutral"
        },
        {
          "field": "Exceptional Items",
          "val1": "0.00",
          "val2": "0.00",
          "chgp": "",
          "chgp_class": "neutral"
        },
        {
          "field": "Consolidate Net Profit",
          "val1": "46.92",
          "val2": "33.62",
          "chgp": "39.56%",
          "chgp_class": "positive"
        },
        {
          "field": "Operating Profit Margin (Excl OI)",
          "val1": "89.21%",
          "val2": "82.72%",
          "chgp": "6.49%",
          "chgp_class": "positive"
        }
      ]
    }
  },
  {
    "link": "annual",
    "btn_text": "All Annual Results",
    "header": "Annual Results Snapshot (Consolidated) - Mar'26",
    "rhs": [
      {
        "prefix": "Net Sales ",
        "suffix": "YoY Growth in year ended Mar 2026 is 14.52% vs 7.57% in Mar 2025",
        "dir": 1
      },
      {
        "prefix": "Consolidated Net Profit ",
        "suffix": "YoY Growth in year ended Mar 2026 is 22.28% vs 5.13% in Mar 2025",
        "dir": 1
      }
    ],
    "table": {
      "header": [
        "Mar'26",
        "Mar'25",
        "Change(%)"
      ],
      "body": [
        {
          "field": "Net Sales",
          "val1": "62.78",
          "val2": "54.82",
          "chgp": "14.52%",
          "chgp_class": "positive"
        },
        {
          "field": "Operating Profit (PBDIT) excl Other Income",
          "val1": "52.12",
          "val2": "42.94",
          "chgp": "21.38%",
          "chgp_class": "positive"
        },
        {
          "field": "Interest",
          "val1": "0.00",
          "val2": "0.01",
          "chgp": "-100.00%",
          "chgp_class": "positive"
        },
        {
          "field": "Exceptional Items",
          "val1": "0.00",
          "val2": "0.00",
          "chgp": "",
          "chgp_class": "neutral"
        },
        {
          "field": "Consolidate Net Profit",
          "val1": "37.82",
          "val2": "30.93",
          "chgp": "22.28%",
          "chgp_class": "positive"
        },
        {
          "field": "Operating Profit Margin (Excl OI)",
          "val1": "83.02%",
          "val2": "78.33%",
          "chgp": "4.69%",
          "chgp_class": "positive"
        }
      ]
    }
  }
]

Quarterly Results Snapshot (Consolidated) - Jun'26 - YoYstock-summary

Jun'26
Jun'25
Change(%)
Net Sales
23.55
12.57
87.35%
Operating Profit (PBDIT) excl Other Income
21.35
10.09
111.60%
Interest
0.00
0.01
-100.00%
Exceptional Items
0.00
0.00
Consolidate Net Profit
20.22
7.92
155.30%
Operating Profit Margin (Excl OI)
90.66%
80.27%
10.39%
Values in Rs Cr.
Direction Arrows
Net Sales

YoY Growth in quarter ended Jun 2026 is 87.35% vs 75.80% in Jun 2025

Direction Arrows
Consolidated Net Profit

YoY Growth in quarter ended Jun 2026 is 155.30% vs 127.59% in Jun 2025

Half Yearly Results Snapshot (Consolidated) - Sep'25stock-summary

Sep'25
Sep'24
Change(%)
Net Sales
41.22
31.89
29.26%
Operating Profit (PBDIT) excl Other Income
36.19
26.87
34.69%
Interest
0.00
0.00
Exceptional Items
0.00
0.00
Consolidate Net Profit
27.46
19.81
38.62%
Operating Profit Margin (Excl OI)
87.80%
84.26%
3.54%
Values in Rs Cr.
Direction Arrows
Net Sales

Growth in half year ended Sep 2025 is 29.26% vs 32.00% in Sep 2024

Direction Arrows
Consolidated Net Profit

Growth in half year ended Sep 2025 is 38.62% vs 36.90% in Sep 2024

Nine Monthly Results Snapshot (Consolidated) - Dec'25stock-summary

Dec'25
Dec'24
Change(%)
Net Sales
68.42
54.24
26.14%
Operating Profit (PBDIT) excl Other Income
61.04
44.87
36.04%
Interest
0.00
0.00
Exceptional Items
0.00
0.00
Consolidate Net Profit
46.92
33.62
39.56%
Operating Profit Margin (Excl OI)
89.21%
82.72%
6.49%
Values in Rs Cr.
Direction Arrows
Net Sales

YoY Growth in nine months ended Dec 2025 is 26.14% vs 19.60% in Dec 2024

Direction Arrows
Consolidated Net Profit

YoY Growth in nine months ended Dec 2025 is 39.56% vs 31.17% in Dec 2024

Annual Results Snapshot (Consolidated) - Mar'26stock-summary

Mar'26
Mar'25
Change(%)
Net Sales
62.78
54.82
14.52%
Operating Profit (PBDIT) excl Other Income
52.12
42.94
21.38%
Interest
0.00
0.01
-100.00%
Exceptional Items
0.00
0.00
Consolidate Net Profit
37.82
30.93
22.28%
Operating Profit Margin (Excl OI)
83.02%
78.33%
4.69%
Values in Rs Cr.
Direction Arrows
Net Sales

YoY Growth in year ended Mar 2026 is 14.52% vs 7.57% in Mar 2025

Direction Arrows
Consolidated Net Profit

YoY Growth in year ended Mar 2026 is 22.28% vs 5.13% in Mar 2025

stock-summaryCompany CV
About SIL Investments Ltd stock-summary
stock-summary
SIL Investments Ltd
Micro Cap
Holding Company
Promoted by late Shri G. D. Birla in November 1934, SIL Investments Limited originally known as Sutlej Cotton Mills Limited (SCML) came to be known as Sutlej Industries Limited upto 2005. During the period 2006-07, the textiles division of Sutlej Industries Limited was demerged and vested effective from 01.07.2005, in a new Company called "Sutlej Textiles And Industries Limited" as a going concern basis as per the scheme of Demerger sanctioned on 12.05.
Company Coordinates stock-summary
Company Details
Pachpahar Road , Bhawanimandi Rajasthan : 326502
stock-summary
Tel: 91-7433-222052/82/90/222115
stock-summary
cs@silinvestments.in/hoffice@sutlej
Registrar Details
Link Intime India Pvt Ltd, C-13 Pannalal Silk Compound, L B S Marg, Bhandup , Mumbai