
Compare Lotus Eye Hospit with Similar Stocks
Dashboard
Company has a low Debt to Equity ratio (avg) at 0.01 times
Poor long term growth as Net Sales has grown by an annual rate of 11.49% over the last 5 years
Flat results in Dec 25
With ROE of 1.1, it has a Very Expensive valuation with a 3.6 Price to Book Value
Majority shareholders : Non Institution
Market Beating Performance
Total Returns (Price + Dividend) 
Latest dividend: 0.5 per share ex-dividend date: Sep-18-2023
Risk Adjusted Returns v/s
Returns Beta

News

Lotus Eye Hospital & Institute Ltd Locks at Upper Circuit With 4.87% Gain — Buyers Queue, Sellers Absent
At Rs 103, the buying was done — not because demand dried up, but because the exchange wouldn't let the stock go any higher. Lotus Eye Hospital & Institute Ltd locked at its upper circuit of 5% on 1 Apr 2026, with buyers queuing and no sellers willing to part with shares.
Read full news article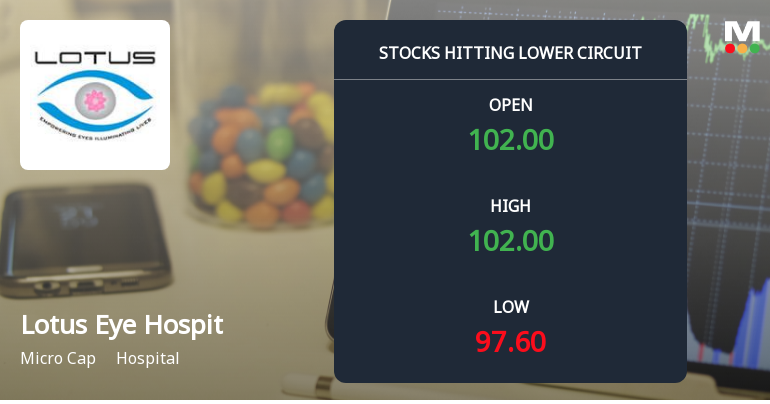
Lotus Eye Hospital & Institute Ltd Locks at Lower Circuit With 3.62% Loss — Sellers Queue, No Buyers in Sight
At Rs 99.00, sellers were still queuing — but there were no buyers willing to take the other side. Lotus Eye Hospital & Institute Ltd locked at its lower circuit of 3.62% on 30 Mar 2026, with unfilled sell orders and a frozen price.
Read full news article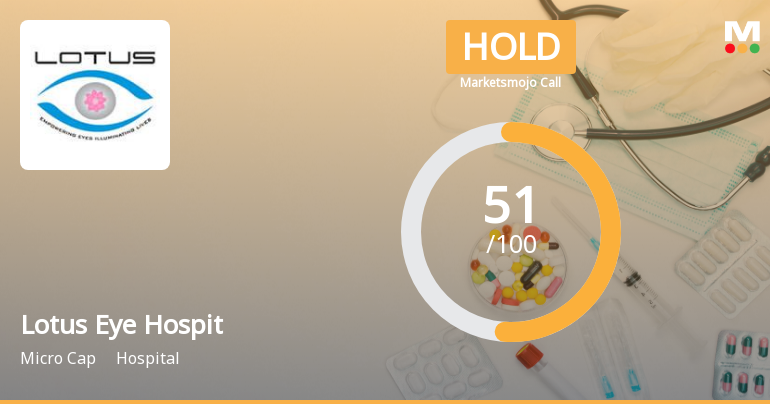
Lotus Eye Hospital & Institute Ltd is Rated Hold
Lotus Eye Hospital & Institute Ltd is rated 'Hold' by MarketsMOJO, with this rating last updated on 30 May 2025. However, the analysis and financial metrics discussed here reflect the stock's current position as of 24 March 2026, providing investors with an up-to-date view of its performance and prospects.
Read full news article Announcements
Lotus Eye Hospital and Institute Limited - Reply to Clarification- Financial results
21-Nov-2019 | Source : NSELotus Eye Hospital and Institute Limiteds Eye Hospital and Institute Limited for the quarter ended 30-Sep-2019 with respect to Regulation 33 of the SEBI (Listing Obligations and Disclosure Requirements) Regulations, 2015.
Lotus Eye Hospital and Institute Limited - Outcome of Board Meeting
15-Nov-2019 | Source : NSELotus Eye Hospital and Institute Limited has informed the Exchange regarding Board meeting held on November 14, 2019.
Lotus Eye Hospital and Institute Limited - Shareholders meeting
26-Sep-2019 | Source : NSELotus Eye Hospital and Institute Limited has informed the Exchange regarding Proceedings of Annual General Meeting held on September 24, 2019. Further, the company has submitted the Exchange a copy of Srutinizers report along with voting results.
Corporate Actions

No Upcoming Board Meetings

Lotus Eye Hospital & Institute Ltd has declared 5% dividend, ex-date: 18 Sep 23

No Splits history available

No Bonus history available

No Rights history available
Quality key factors
Valuation key factors
Technicals key factors
 Technical Indicator Scale: Bearish, Mildly Bearish, Sideways, Mildly Bullish, Bullish Turned
 Shareholding Snapshot : Dec 2025
Shareholding Compare (%holding)
Non Institution
None
Held by 0 Schemes
Held by 1 FIIs (0.01%)
Sangeetha S (28.14%)
Kovai Purani Finance Private Limited (7.5%)
38.12%
Quarterly Results Snapshot (Standalone) - Dec'25 - QoQ

QoQ Growth in quarter ended Dec 2025 is 3.91% vs -3.55% in Sep 2025

QoQ Growth in quarter ended Dec 2025 is -316.67% vs -77.78% in Sep 2025
Half Yearly Results Snapshot (Standalone) - Sep'25
Growth in half year ended Sep 2025 is 2.95% vs 1.98% in Sep 2024
Growth in half year ended Sep 2025 is -9.59% vs -67.26% in Sep 2024
Nine Monthly Results Snapshot (Standalone) - Dec'25
YoY Growth in nine months ended Dec 2025 is 5.41% vs 1.93% in Dec 2024
YoY Growth in nine months ended Dec 2025 is -18.37% vs -83.04% in Dec 2024
Annual Results Snapshot (Standalone) - Mar'25
YoY Growth in year ended Mar 2025 is 2.80% vs 2.49% in Mar 2024
YoY Growth in year ended Mar 2025 is -74.57% vs -28.68% in Mar 2024
About Lotus Eye Hospital & Institute Ltd

Company Coordinates


