
 Price Point
Compare TGV Sraac with Similar Stocks
ScoreDashboard
Strong ability to service debt as the company has a low Debt to EBITDA ratio of 1.01 times
Positive results in Jan 70
With ROCE of 11.3, it has a Attractive valuation with a 1 Enterprise value to Capital Employed
Majority shareholders : Promoters
Mojo ParametersStock DNA

Commodity Chemicals

INR Cr (Micro Cap)

10.00
NA

0.00%

0.00

0.00%

0.00
Total ReturnsTotal Returns (Price + Dividend) 

Risk Adjusted Returns v/s
Returns Beta
News & Corporate ActionsNews
TGV Sraac Ltd Upgraded to Buy on Improved Technicals and Attractive Valuation
TGV Sraac Ltd, a micro-cap player in the commodity chemicals sector, has seen its investment rating upgraded from Hold to Buy as of 25 September 2026. This upgrade reflects significant improvements across technical indicators, valuation metrics, financial trends, and overall quality assessments, signalling renewed investor confidence in the stock’s prospects.
Read full news article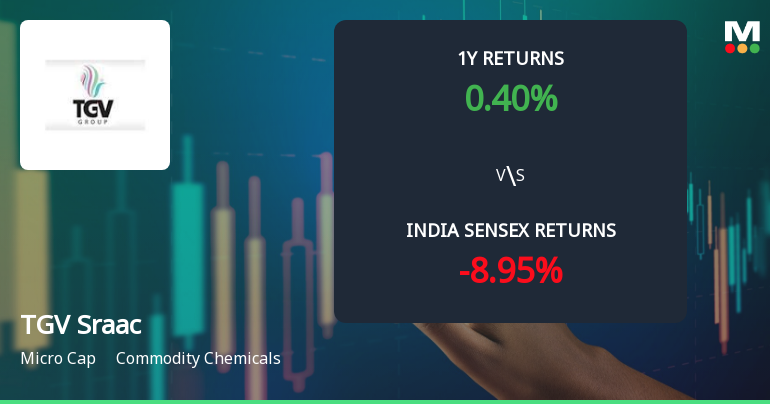
TGV Sraac Ltd Technical Momentum Shifts Signal Bullish Outlook
TGV Sraac Ltd, a micro-cap player in the Commodity Chemicals sector, has demonstrated a significant shift in technical momentum, upgrading its outlook from mildly bullish to bullish. This change is underpinned by strong price action, robust moving averages, and positive signals from key technical indicators such as MACD and Bollinger Bands, despite some mixed readings from momentum oscillators like RSI and KST.
Read full news article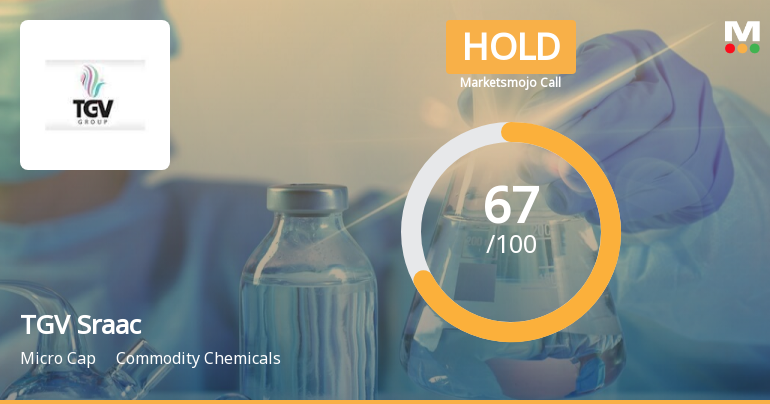
TGV Sraac Ltd is Rated Hold by MarketsMOJO
TGV Sraac Ltd is rated 'Hold' by MarketsMOJO, with this rating last updated on 09 September 2026. However, the analysis and financial metrics discussed here reflect the stock’s current position as of 21 September 2026, providing investors with an up-to-date view of the company’s fundamentals, valuation, financial trends, and technical outlook.
Read full news article Announcements
Corporate Actions

No Upcoming Board Meetings

TGV Sraac Ltd has declared 10% dividend, ex-date: 18 Sep 26

No Splits history available

No Bonus history available

No Rights history available
Key FactorsQuality key factors
Valuation key factors
Technicals key factors
 Technical Indicator Scale: Bearish, Mildly Bearish, Sideways, Mildly Bullish, Bullish Turned Shareholding
Shareholding Snapshot : Jun 2026
Shareholding Compare (%holding)
Promoters
None
Held by 14 Schemes (0.02%)
Held by 3 FIIs (0.12%)
Brilliant Industries Private Limited (24.95%)
None
32.43%
FinancialQuarterly Results Snapshot (Standalone) - Jun'26 - QoQ
 Compare with Peers
QoQ Growth in quarter ended Jun 2026 is 6.26% vs 14.02% in Mar 2026

QoQ Growth in quarter ended Jun 2026 is 62.27% vs -0.39% in Mar 2026

Half Yearly Results Snapshot (Standalone) - Sep'25
Growth in half year ended Sep 2025 is 22.77% vs 4.05% in Sep 2024
Growth in half year ended Sep 2025 is 62.63% vs 21.54% in Sep 2024
Nine Monthly Results Snapshot (Standalone) - Dec'25
YoY Growth in nine months ended Dec 2025 is 14.02% vs 7.15% in Dec 2024
YoY Growth in nine months ended Dec 2025 is 47.54% vs 31.48% in Dec 2024
Annual Results Snapshot (Standalone) - Mar'26
YoY Growth in year ended Mar 2026 is 11.50% vs 13.14% in Mar 2025
YoY Growth in year ended Mar 2026 is 43.17% vs 51.71% in Mar 2025
 Company CV
About TGV Sraac Ltd










