
Dashboard
Weak Long Term Fundamental Strength with a -36.78% CAGR growth in Operating Profits over the last 5 years
With a fall in Net Profit of -130.77%, the company declared Very Negative results in Sep 25
Falling Participation by Institutional Investors
Below par performance in long term as well as near term
Stock DNA
Paper, Forest & Jute Products
INR 475 Cr (Micro Cap)
57.00
18
0.00%
0.61
1.87%
1.07
Total Returns (Price + Dividend) 
Latest dividend: 2.4 per share ex-dividend date: Sep-22-2023
Risk Adjusted Returns v/s
Returns Beta

News

Pakka Stock Evaluation Revised Amid Weak Financial and Technical Indicators
Pakka, a microcap player in the Paper, Forest & Jute Products sector, has experienced a revision in its market assessment reflecting challenges across multiple evaluation parameters. The recent shift in analytical perspective highlights deteriorating financial trends and technical outlook, despite valuation metrics remaining attractive.
Read More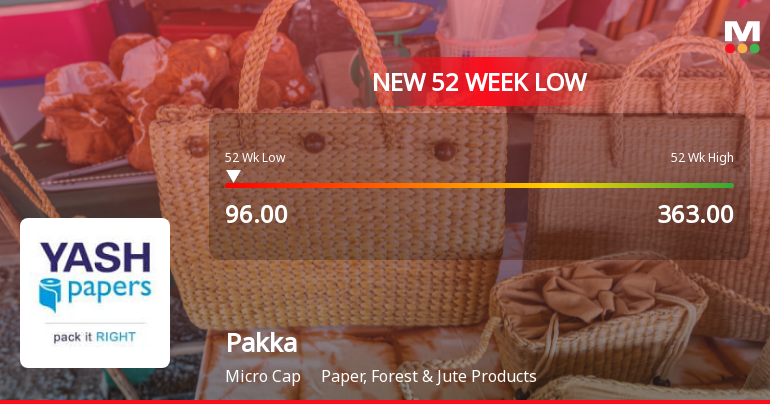
Pakka Stock Falls to 52-Week Low of Rs.96 Amid Continued Downtrend
Shares of Pakka, a company operating in the Paper, Forest & Jute Products sector, reached a fresh 52-week low of Rs.96 today, marking a significant milestone in its ongoing decline. The stock has been under pressure for several sessions, reflecting a challenging period for the company amid subdued financial performance and market conditions.
Read More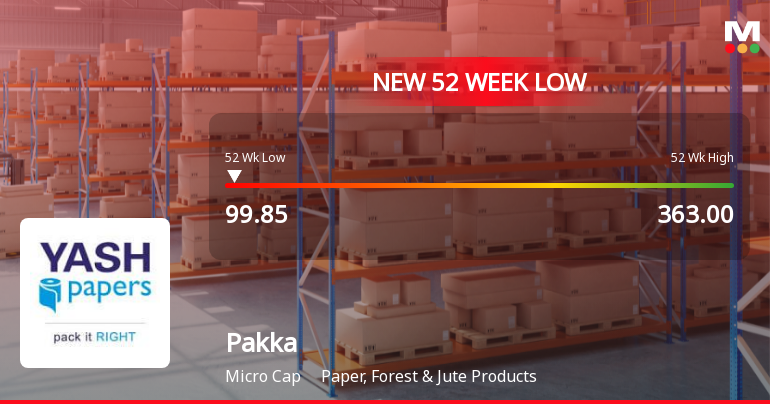
Pakka Stock Falls to 52-Week Low of Rs.99.85 Amidst Prolonged Downtrend
Shares of Pakka, a company operating in the Paper, Forest & Jute Products sector, touched a fresh 52-week low of Rs.99.85 today, marking a significant milestone in its ongoing downward trajectory. This new low comes after a series of declines, reflecting persistent pressures on the stock amid subdued financial performance and sector headwinds.
Read More Announcements
Corporate Actions

No Upcoming Board Meetings

Pakka Ltd has declared 24% dividend, ex-date: 22 Sep 23

No Splits history available

No Bonus history available

No Rights history available
Quality key factors
Valuation key factors
Technicals key factors
 Technical Indicator Scale: Bearish, Mildly Bearish, Sideways, Mildly Bullish, Bullish Turned
 Shareholding Snapshot : Sep 2025
Shareholding Compare (%holding)
Non Institution
8.9412
Held by 2 Schemes (7.45%)
Held by 9 FIIs (0.21%)
Ved Krishna (30.8%)
Sbi Magnum Children's Benefit Fund - Investment Plan (7.44%)
41.46%
Quarterly Results Snapshot (Consolidated) - Sep'25 - QoQ

QoQ Growth in quarter ended Sep 2025 is -6.89% vs -11.06% in Jun 2025
QoQ Growth in quarter ended Sep 2025 is -37.91% vs -147.96% in Jun 2025
Half Yearly Results Snapshot (Consolidated) - Sep'25

Growth in half year ended Sep 2025 is -23.86% vs -1.40% in Sep 2024
Growth in half year ended Sep 2025 is -114.31% vs 0.12% in Sep 2024
Nine Monthly Results Snapshot (Consolidated) - Dec'24
YoY Growth in nine months ended Dec 2024 is 1.20% vs 4.36% in Dec 2023
YoY Growth in nine months ended Dec 2024 is -2.80% vs 2.94% in Dec 2023
Annual Results Snapshot (Consolidated) - Mar'25
YoY Growth in year ended Mar 2025 is 0.32% vs -0.87% in Mar 2024
YoY Growth in year ended Mar 2025 is -13.55% vs -5.88% in Mar 2024
About Pakka Ltd

Company Coordinates


