
Compare Expensify, Inc. with Similar Stocks
Dashboard
The company has declared negative results in Mar'2025 after 3 consecutive positive quarters
- RAW MATERIAL COST(Y) Grown by 9.52% (YoY)
- OPERATING PROFIT(Q) Lowest at USD -8.14 MM
- OPERATING PROFIT MARGIN(Q) Lowest at -22.76 %
Risky - Negative Operating Profits
Below par performance in long term as well as near term
Stock DNA
Software Products
USD 117 Million (Micro Cap)
NA (Loss Making)
NA
0.00%
-0.58
-11.49%
0.86
Total Returns (Price + Dividend) 
Expensify, Inc. for the last several years.
Risk Adjusted Returns v/s
News
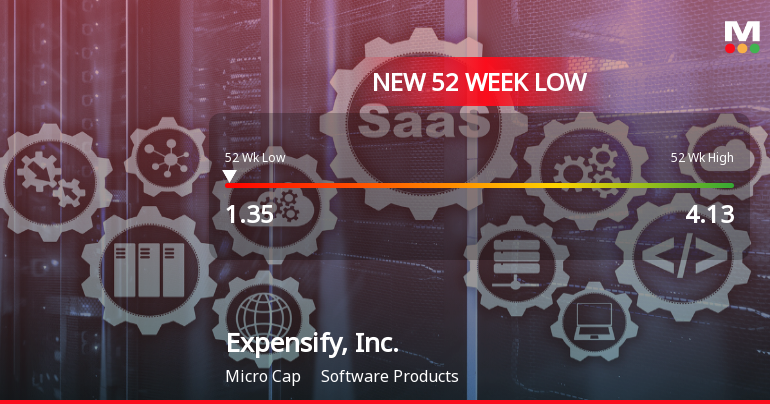
Expensify, Inc. Stock Plummets to New 52-Week Low of $1.35
Expensify, Inc. has reached a new 52-week low, reflecting a significant downturn in its stock performance. The company, with a market capitalization of USD 181 million, is currently operating at a loss, highlighted by a negative price-to-earnings ratio and a substantial operating profit loss.
Read full news article Announcements

Corporate Actions
Quality key factors
Valuation key factors
Technicals key factors
 Technical Indicator Scale: Bearish, Mildly Bearish, Sideways, Mildly Bullish, Bullish Turned
 Shareholding Snapshot : Sep 2025
Shareholding Compare (%holding)
Domestic Funds
Held in 31 Schemes (15.45%)
Held by 51 Foreign Institutions (8.32%)
Quarterly Results Snapshot (Consolidated) - Sep'25 - QoQ

QoQ Growth in quarter ended Sep 2025 is -1.96% vs -0.83% in Jun 2025

QoQ Growth in quarter ended Sep 2025 is 73.86% vs -175.00% in Jun 2025
Annual Results Snapshot (Consolidated) - Dec'24
YoY Growth in year ended Dec 2024 is -7.63% vs -11.09% in Dec 2023
YoY Growth in year ended Dec 2024 is 75.66% vs -53.70% in Dec 2023
About Expensify, Inc.

Company Coordinates


