
Compare LanzaTech Global, Inc. with Similar Stocks
Dashboard
With a Negative Book Value, the company has a Weak Long Term Fundamental Strength
- Poor long term growth as Net Sales has grown by an annual rate of -8.09% and Operating profit at -255.73% over the last 5 years
- Company's ability to service its debt is weak with a poor EBIT to Interest (avg) ratio of -60.46
The company has declared Negative results for the last 3 consecutive quarters
Risky - Negative EBITDA
Below par performance in long term as well as near term
Total Returns (Price + Dividend) 
LanzaTech Global, Inc. for the last several years.
Risk Adjusted Returns v/s
News
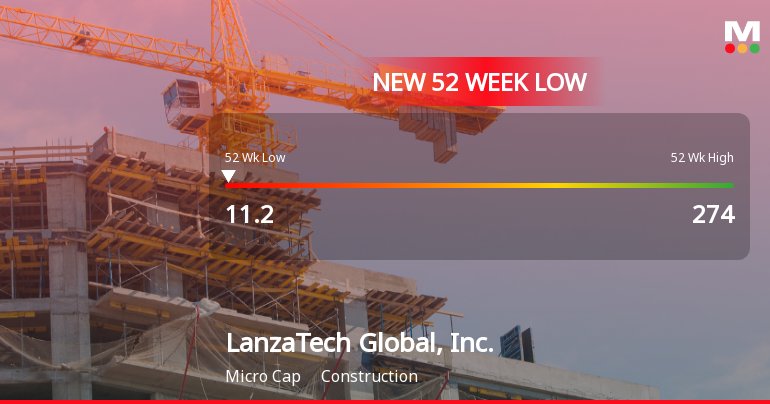
LanzaTech Global Hits 52-Week Low at $11.20 Amid Ongoing Struggles
LanzaTech Global, Inc. has reached a new 52-week low, reflecting ongoing challenges as its stock price has dramatically declined over the past year. The company has reported negative results for three consecutive quarters, with significant operational difficulties indicated by its financial metrics, including a high debt-to-equity ratio.
Read full news article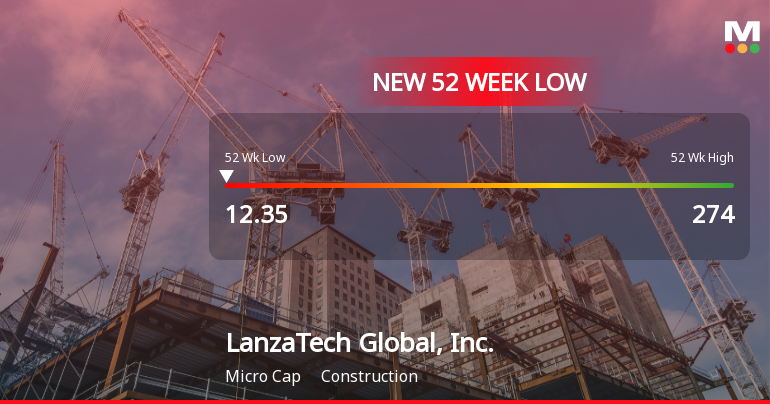
LanzaTech Global Hits New 52-Week Low at $12.35 Amidst Struggles
LanzaTech Global, Inc. has reached a new 52-week low, reflecting ongoing financial struggles with three consecutive quarters of negative results and a significant net loss. Despite a strong one-year performance, the company faces declining sales, high debt levels, and concerns about its long-term viability amid challenging financial metrics.
Read full news article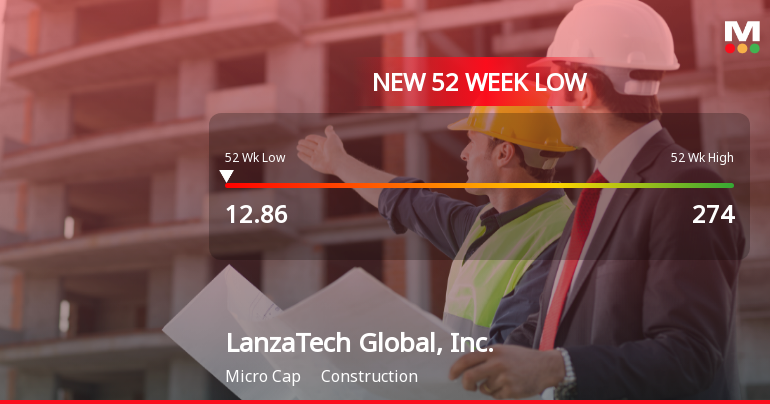
LanzaTech Global Hits 52-Week Low at $12.86 Amidst Financial Struggles
LanzaTech Global, Inc. has reached a new 52-week low, reflecting ongoing financial struggles. The company has reported negative results for three consecutive quarters, with significant losses and a challenging debt-to-equity ratio. Despite a notable increase in stock price, concerns about its long-term viability persist.
Read full news article Announcements

Corporate Actions
Quality key factors
Valuation key factors
Technicals key factors
 Technical Indicator Scale: Bearish, Mildly Bearish, Sideways, Mildly Bullish, Bullish Turned
 Shareholding Snapshot : Sep 2025
Shareholding Compare (%holding)
Strategic Entities
Held in 24 Schemes (6.97%)
Held by 33 Foreign Institutions (7.64%)
Quarterly Results Snapshot (Consolidated) - Jun'25 - YoY

YoY Growth in quarter ended Jun 2025 is -47.70% vs 34.88% in Jun 2024
YoY Growth in quarter ended Jun 2025 is -16.91% vs -3.73% in Jun 2024
Annual Results Snapshot (Consolidated) - Dec'24
YoY Growth in year ended Dec 2024 is -20.77% vs 67.83% in Dec 2023

YoY Growth in year ended Dec 2024 is -2.68% vs -75.52% in Dec 2023
About LanzaTech Global, Inc.

Company Coordinates


