
Stock DNA
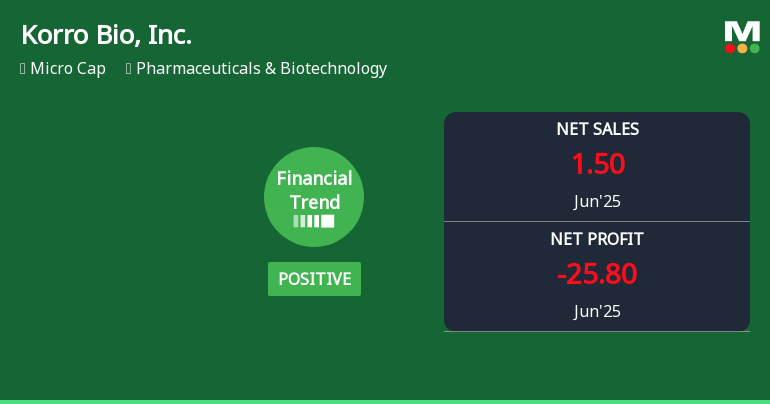
Pharmaceuticals & Biotechnology
USD 309 Million (Micro Cap)
NA
0.00%
-0.82
-999,999.00%
2.69
Total Returns (Price + Dividend) 
Korro Bio, Inc. for the last several years.
Risk Adjusted Returns v/s
News
Korro Bio, Inc. Experiences Revision in Stock Evaluation Amid Mixed Financial Performance
Korro Bio, Inc. reported net sales of USD 4.01 million for the quarter ending June 2025, reflecting improved revenue generation and cost management. However, the company struggles with a significant operating loss and declining earnings per share. Its debtors turnover ratio indicates effective collection practices amid ongoing market challenges.
Read More
Korro Bio Forms Golden Cross, Signaling Potential Bullish Breakout Ahead
Korro Bio, Inc. has recently achieved a Golden Cross, indicating a potential shift in momentum. The stock has outperformed the S&P 500, with a notable monthly increase of 77.53%. Despite mixed technical indicators, Korro Bio's one-year performance of 47.67% highlights its strong market position and investor interest.
Read More Announcements

Corporate Actions
Quality key factors
Valuation key factors
Technicals key factors
 Technical Indicator Scale: Bearish, Mildly Bearish, Sideways, Mildly Bullish, Bullish Turned
 Shareholding Snapshot : Mar 2025
Shareholding Compare (%holding)
Strategic Entities
Held in 22 Schemes (22.24%)
Held by 35 Foreign Institutions (9.89%)
Quarterly Results Snapshot (Consolidated) - Jun'25 - YoY
YoY Growth in quarter ended Jun 2025 is 0.00% vs 0.00% in Jun 2024

YoY Growth in quarter ended Jun 2025 is -18.35% vs -23.86% in Jun 2024
Annual Results Snapshot (Consolidated) - Dec'24
YoY Growth in year ended Dec 2024 is 0.00% vs 0.00% in Dec 2023
YoY Growth in year ended Dec 2024 is -2.96% vs -40.00% in Dec 2023
About Korro Bio, Inc.

Company Coordinates


