
Stock DNA
Electronics & Appliances
USD 8 Million (Micro Cap)
NA (Loss Making)
NA
0.00%
-1.03
-24.16%
1.65
Total Returns (Price + Dividend) 
Moving iMage Technologies, Inc. for the last several years.
Risk Adjusted Returns v/s
News
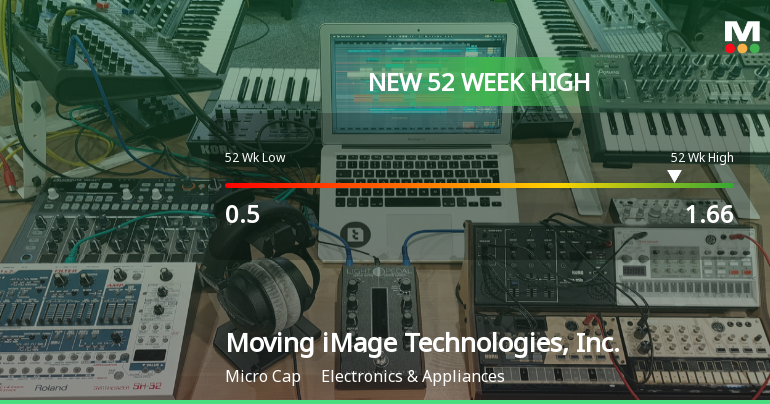
Moving iMage Technologies, Inc. Hits New 52-Week High of $1.66
Moving iMage Technologies, Inc. achieved a new 52-week high of USD 1.66 on September 23, 2025, reflecting a 158.77% increase over the past year. The company, with a market capitalization of USD 8 million, continues to operate at a loss, evidenced by a negative return on equity.
Read MoreIs Moving iMage Technologies, Inc. technically bullish or bearish?
As of 9 September 2025, the technical trend for Moving iMage Technologies, Inc. has changed from mildly bullish to bullish. The weekly MACD and OBV are both bullish, indicating strong upward momentum, while Bollinger Bands also show a bullish stance in both weekly and monthly timeframes. Daily moving averages confirm a bullish trend as well. The Dow Theory indicates a mildly bullish position on both weekly and monthly charts. In terms of performance, the company has significantly outperformed the S&P 500 over the past year, with a return of 128.32% compared to the S&P 500's 17.14%. Overall, the technical stance is bullish with strong momentum indicators supporting this view....
Read More Announcements

Corporate Actions
Quality key factors
Valuation key factors
Technicals key factors
 Technical Indicator Scale: Bearish, Mildly Bearish, Sideways, Mildly Bullish, Bullish Turned
 Shareholding Snapshot : Mar 2025
Shareholding Compare (%holding)
Domestic Funds
Held in 3 Schemes (0.89%)
Held by 1 Foreign Institutions (0.15%)
Quarterly Results Snapshot (Consolidated) - Mar'25 - QoQ

QoQ Growth in quarter ended Mar 2025 is 5.88% vs -35.85% in Dec 2024
QoQ Growth in quarter ended Mar 2025 is 60.00% vs 0.00% in Dec 2024
Annual Results Snapshot (Consolidated) - Jun'24

YoY Growth in year ended Jun 2024 is -0.50% vs 9.78% in Jun 2023
YoY Growth in year ended Jun 2024 is 22.22% vs -38.46% in Jun 2023
About Moving iMage Technologies, Inc.

Company Coordinates


