
Compare Acme Resources with Similar Stocks
Dashboard
Weak Long Term Fundamental Strength with an average Return on Equity (ROE) of 3.47%
- Poor long term growth as Net Sales has grown by an annual rate of 5.74%
Flat results in Mar 26
With ROE of 1.1, it has a Very Expensive valuation with a 0.6 Price to Book Value
Below par performance in long term as well as near term
Stock DNA
Non Banking Financial Company (NBFC)
INR 75 Cr (Micro Cap)
54.00
20
0.00%
0.07
1.08%
0.59
Total Returns (Price + Dividend) 
Acme Resources for the last several years.
Risk Adjusted Returns v/s
Returns Beta

News

Acme Resources Ltd is Rated Strong Sell
Acme Resources Ltd is rated Strong Sell by MarketsMOJO, with this rating last updated on 14 Feb 2025. However, the analysis and financial metrics presented here reflect the stock’s current position as of 08 June 2026, providing investors with an up-to-date view of the company’s fundamentals, valuation, financial trends, and technical outlook.
Read full news article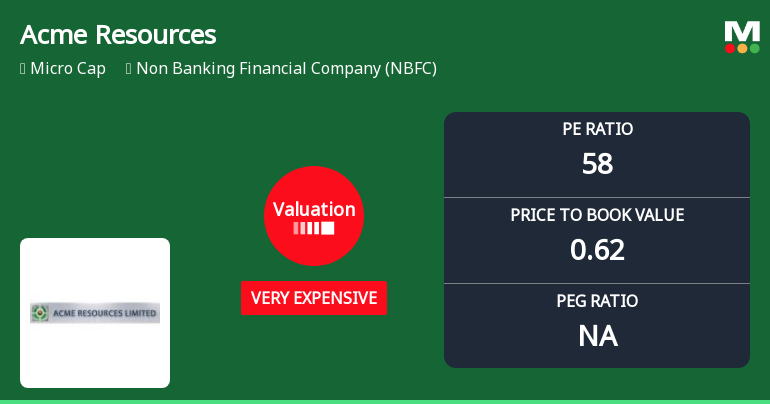
Acme Resources Ltd Valuation Shifts Signal Heightened Price Risk
Acme Resources Ltd, a micro-cap player in the Non Banking Financial Company (NBFC) sector, has seen its valuation parameters shift markedly, with its price-to-earnings (P/E) ratio climbing to 57.61, categorising it as very expensive. Despite this, the stock’s recent returns have been mixed, outperforming the Sensex over longer horizons but lagging year-to-date and over the past year. This article analyses the valuation changes, compares Acme Resources with its peers, and assesses the implications for investors.
Read full news article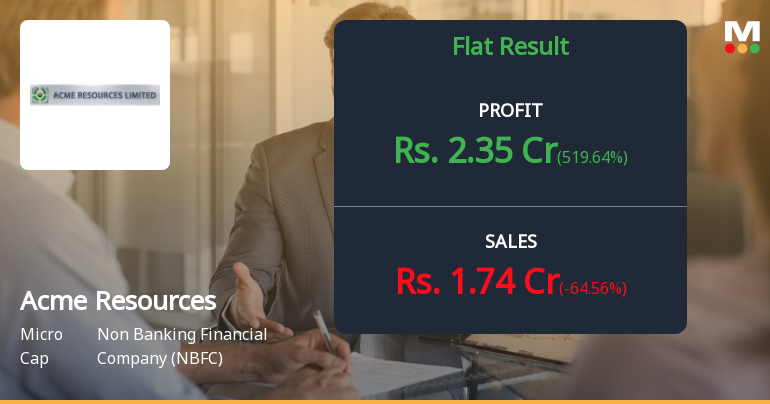
Acme Resources Q4 FY26: Erratic Performance Masks Deeper Structural Concerns
Acme Resources Ltd., a micro-cap non-banking financial company with a market capitalisation of ₹83.00 crores, reported wildly volatile quarterly results for Q4 FY26 (March 2026 quarter), with net profit swinging sharply to ₹2.35 crores compared to a loss of ₹3.03 crores in the preceding quarter. However, this apparent recovery masks severe underlying concerns, as revenue collapsed by 46.63% quarter-on-quarter and the company's performance remains heavily dependent on volatile non-operating income rather than sustainable business operations.
Read full news article Announcements
Results For Consideration And Approval Of Audited Standalone And Consolidated Financial Results For The Quarter And Financial Year Ended 31St March 2026
29-May-2026 | Source : BSEResults for consideration and approval of Audited Standalone and Consolidated Financial Results for the Quarter and Financial Year ended 31st March 2026
Compliances-Reg.24(A)-Annual Secretarial Compliance
29-May-2026 | Source : BSEAnnual Secretarial Compliance Report for the Financial Year ended 31st March 2026.
Board Meeting Outcome for Outcome Of Board Meeting For Consideration And Approval Of Audited Financial Statements For The Quarter And Financial Year Ended 31St March 2026.
29-May-2026 | Source : BSEOutcome of Board Meeting for consideration and approval of Audited Financial Statements for the quarter and financial year ended 31st March 2026.
Corporate Actions

No Upcoming Board Meetings

No Dividend history available

No Splits history available

No Bonus history available

No Rights history available
Quality key factors
Valuation key factors
Technicals key factors
 Technical Indicator Scale: Bearish, Mildly Bearish, Sideways, Mildly Bullish, Bullish Turned
 Shareholding Snapshot : Mar 2026
Shareholding Compare (%holding)
Promoters
None
Held by 0 Schemes
Held by 0 FIIs
Narayani Dealers Private Limited (44.87%)
Salvo Dealcomm Private Limited (14.57%)
10.59%
Quarterly Results Snapshot (Consolidated) - Mar'26 - YoY

YoY Growth in quarter ended Mar 2026 is -64.56% vs 166.85% in Mar 2025

YoY Growth in quarter ended Mar 2026 is 519.64% vs 61.11% in Mar 2025
Half Yearly Results Snapshot (Consolidated) - Sep'25
Growth in half year ended Sep 2025 is -0.49% vs -23.55% in Sep 2024
Growth in half year ended Sep 2025 is -29.77% vs 90.45% in Sep 2024
Nine Monthly Results Snapshot (Consolidated) - Dec'25
YoY Growth in nine months ended Dec 2025 is 22.17% vs -35.14% in Dec 2024
YoY Growth in nine months ended Dec 2025 is -122.68% vs 30.16% in Dec 2024
Annual Results Snapshot (Consolidated) - Mar'26
YoY Growth in year ended Mar 2026 is -16.87% vs 11.55% in Mar 2025
YoY Growth in year ended Mar 2026 is -59.89% vs 107.02% in Mar 2025
About Acme Resources Ltd

Company Coordinates


