
 Price Point
Compare Leela Palaces Ho with Similar Stocks
ScoreDashboard
Weak Long Term Fundamental Strength with an average Return on Equity (ROE) of 6.38%
- Poor long term growth as Net Sales has grown by an annual rate of 14.20% over the last 5 years
Flat results in Jun 26
With ROCE of 7.9, it has a Very Expensive valuation with a 2.5 Enterprise value to Capital Employed
100% of Promoter Shares are Pledged
Mojo ParametersStock DNA

Hotels & Resorts

INR 18,055 Cr (Small Cap)

40.00
36

0.00%

0.24

6.38%

2.81
Total ReturnsTotal Returns (Price + Dividend) 
Leela Palaces Ho for the last several years.
Risk Adjusted Returns v/s
Returns Beta
 News & Corporate Actions
News
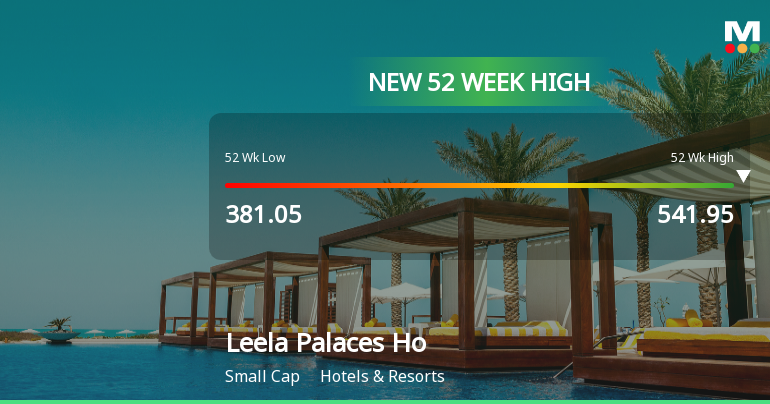
Broad-Based Technical Strength Lifts Leela Palaces Hotels & Resorts to 52-Week High of Rs 541.95
Surging past its previous peaks, Leela Palaces Hotels & Resorts touched a new 52-week high of Rs 541.95 on 20 Aug 2026, marking a notable milestone in its price momentum. This advance comes amid a backdrop of strong technical signals and sustained upward movement across multiple timeframes.
Read full news article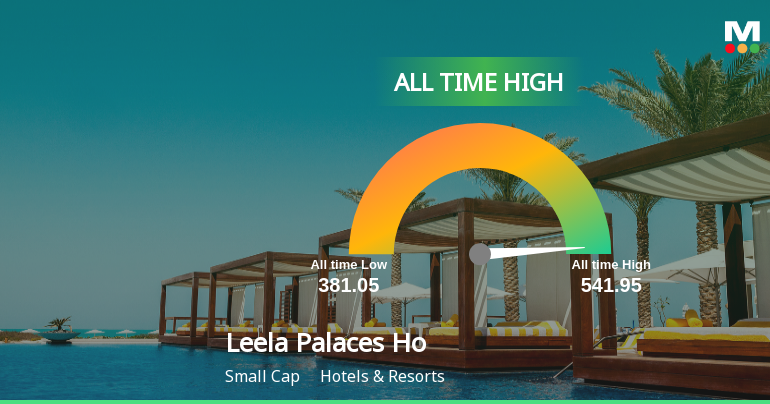
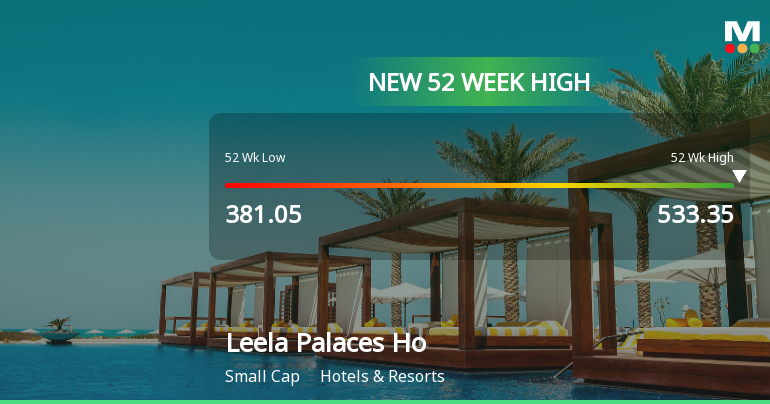
Broad-Based Technical Strength Lifts Leela Palaces Hotels & Resorts Ltd to 52-Week High of Rs 533.35
Surging to an intraday peak of Rs 533.35 on 19 Aug 2026, Leela Palaces Hotels & Resorts Ltd has marked a fresh 52-week and all-time high, propelled by a confluence of bullish technical indicators and sustained price momentum.
Read full news article Announcements
Announcement under Regulation 30 (LODR)-Newspaper Publication
14-Aug-2026 | Source : BSENewspaper advertisement confirming dispatch of Notice of Seventh Annual General meeting along with Annaul report of Leela Palaces Hotels & Resorts Limited.
Business Responsibility and Sustainability Reporting (BRSR)
13-Aug-2026 | Source : BSEBusiness Responsibility and Sustainability Report of Leela Palaces Hotels & Resorts Limited for the financial year 2025-26
Notice Of Seventh Annual General Meeting Of The Company
13-Aug-2026 | Source : BSENotice of Seventh Annual General Meeting of the Company scheduled to be held on September 4 2026
Corporate Actions

No Upcoming Board Meetings

No Dividend history available

No Splits history available

No Bonus history available

No Rights history available
Key FactorsQuality key factors
Valuation key factors
Technicals key factors
 Technical Indicator Scale: Bearish, Mildly Bearish, Sideways, Mildly Bullish, Bullish Turned Shareholding
Shareholding Snapshot : Jun 2026
Shareholding Compare (%holding)
Promoters
100
Held by 26 Schemes (7.67%)
Held by 70 FIIs (7.87%)
Project Ballet Banglore Holdings (difc)pvt Ltd (45.81%)
Icici Prudential Equity & Debt Fund (2%)
2.55%
FinancialQuarterly Results Snapshot (Consolidated) - Jun'26 - QoQ
 Compare with Peers
QoQ Growth in quarter ended Jun 2026 is -27.34% vs 5.90% in Mar 2026
QoQ Growth in quarter ended Jun 2026 is -71.59% vs 16.15% in Mar 2026

Half Yearly Results Snapshot (Standalone) - Sep'25
Not Applicable: The company has declared_date for only one period
Not Applicable: The company has declared_date for only one period
Nine Monthly Results Snapshot (Standalone) - Dec'25
Not Applicable: The company has declared_date for only one period
Not Applicable: The company has declared_date for only one period
Annual Results Snapshot (Consolidated) - Mar'26

YoY Growth in year ended Mar 2026 is 17.43% vs 11.02% in Mar 2025
YoY Growth in year ended Mar 2026 is 742.84% vs 2,345.54% in Mar 2025
 Company CV
About Leela Palaces Hotels & Resorts Ltd

Company Coordinates








