
Compare Grovy India with Similar Stocks
Total Returns (Price + Dividend) 
Latest dividend: 0.09935391241923906 per share ex-dividend date: Sep-23-2025
Risk Adjusted Returns v/s
Returns Beta

News

Grovy India Ltd Upgraded to Hold as Technicals and Valuation Improve
Grovy India Ltd, a micro-cap player in the Realty sector, has seen its investment rating upgraded from Sell to Hold as of 23 June 2026. This change reflects improvements across multiple parameters including valuation attractiveness and technical indicators, despite flat recent financial performance. The company’s stock has demonstrated strong relative returns over various time horizons, prompting a reassessment of its market stance.
Read full news article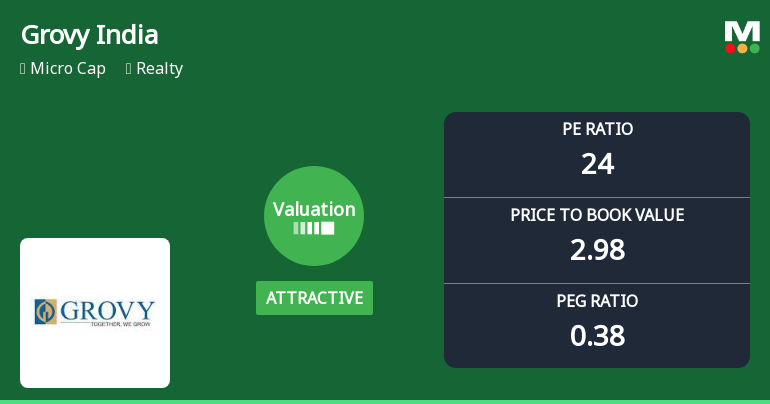
Grovy India Ltd Valuation Shifts Signal Renewed Price Attractiveness Amid Realty Sector Dynamics
Grovy India Ltd, a micro-cap player in the Realty sector, has seen a notable shift in its valuation parameters, moving from fair to attractive territory. This change comes alongside robust stock performance that has significantly outpaced the Sensex over multiple time horizons, signalling renewed investor interest despite a recent dip in share price.
Read full news article
Broad-Based Technical Strength Lifts Grovy India Ltd to 52-Week High of Rs 58.99
With a decisive intraday surge, Grovy India Ltd reached a fresh 52-week high of Rs 58.99 on 22 Jun 2026, marking a significant milestone in its price momentum despite a recent two-day pullback. This breakout comes amid a backdrop of strong technical signals across multiple timeframes, underscoring the stock’s robust upward trajectory within the Realty sector.
Read full news article Announcements
Announcement under Regulation 30 (LODR)-Newspaper Publication
17-Jun-2026 | Source : BSEFor Post Dispatch of AGM Notice.
Announcement under Regulation 30 (LODR)-Date of payment of Dividend
16-Jun-2026 | Source : BSEPlease find the enclosed herewith the Intimation of Book Closure and Cut-off Date/Record Date pursuant to Regulation 42 of SEBI (Listing Obligations and Disclosure Requirements) Regulations.
Announcement under Regulation 30 (LODR)-Newspaper Publication
16-Jun-2026 | Source : BSEPlease find the enclosed copies of the newspaper advertisements published in Financial Express (English) and Jansatta (Hindi) regarding the Notice of 41st Annual General Meeting of Grovy India Limited.
Corporate Actions

No Upcoming Board Meetings

Grovy India Ltd has declared 1% dividend, ex-date: 01 Jul 26

No Splits history available

Grovy India Ltd has announced 3:1 bonus issue, ex-date: 23 Oct 24

No Rights history available
Quality key factors
Valuation key factors
Technicals key factors
 Technical Indicator Scale: Bearish, Mildly Bearish, Sideways, Mildly Bullish, Bullish Turned
 Shareholding Snapshot : Mar 2026
Shareholding Compare (%holding)
Promoters
None
Held by 0 Schemes
Held by 0 FIIs
Prakash Chand Jalan (22.66%)
Oceanic Auto Finlease Private Limited (2.95%)
18.67%
Quarterly Results Snapshot (Standalone) - Mar'26 - QoQ

QoQ Growth in quarter ended Mar 2026 is 133.00% vs -79.95% in Dec 2025
QoQ Growth in quarter ended Mar 2026 is 64.81% vs 42.11% in Dec 2025
Half Yearly Results Snapshot (Standalone) - Sep'25
Growth in half year ended Sep 2025 is 879.32% vs -76.53% in Sep 2024
Growth in half year ended Sep 2025 is 739.13% vs -128.75% in Sep 2024
Nine Monthly Results Snapshot (Standalone) - Dec'25

YoY Growth in nine months ended Dec 2025 is 19.03% vs 37.28% in Dec 2024
YoY Growth in nine months ended Dec 2025 is 26.42% vs 63.92% in Dec 2024
Annual Results Snapshot (Standalone) - Mar'26
YoY Growth in year ended Mar 2026 is 30.61% vs 30.03% in Mar 2025
YoY Growth in year ended Mar 2026 is 62.01% vs 79.00% in Mar 2025
About Grovy India Ltd

Company Coordinates


