
Compare Hi-Tech Pipes with Similar Stocks
Stock DNA
Iron & Steel Products
INR 1,749 Cr (Small Cap)
23.00
24
0.02%
0.14
5.71%
1.30
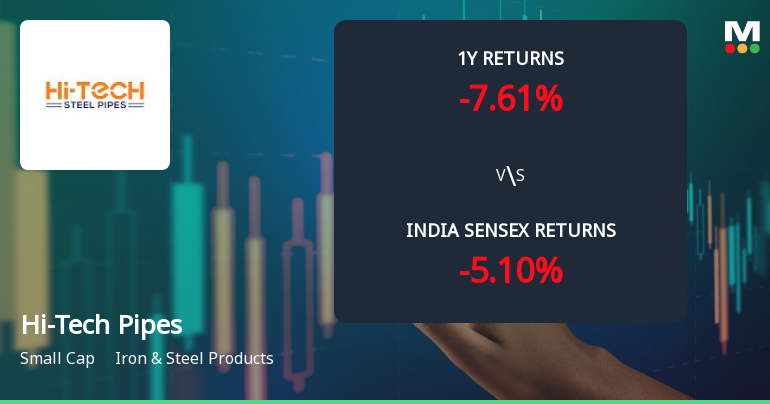
Total Returns (Price + Dividend) 
Latest dividend: 0.02 per share ex-dividend date: Sep-19-2025
Risk Adjusted Returns v/s
Returns Beta

News
Hi-Tech Pipes Ltd Faces Bearish Momentum Amid Mixed Technical Signals
Hi-Tech Pipes Ltd, a small-cap player in the Iron & Steel Products sector, has experienced a notable shift in its technical momentum, moving from mildly bearish to a more pronounced bearish stance. Despite some mildly bullish weekly MACD signals, the overall technical indicators suggest caution for investors as the stock price continues to underperform relative to the broader market benchmarks.
Read full news article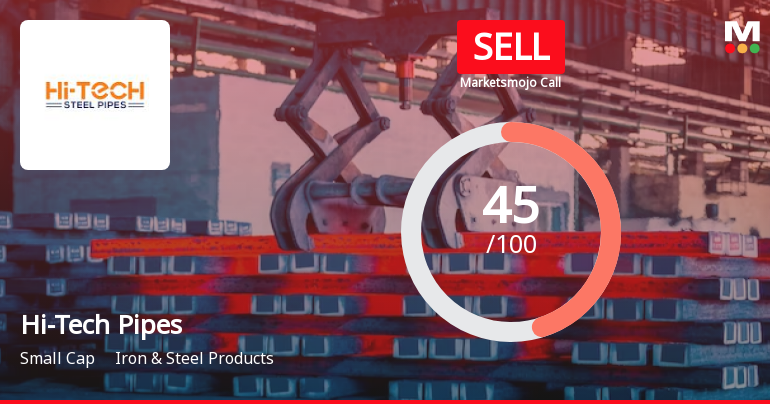
Hi-Tech Pipes Ltd is Rated Sell
Hi-Tech Pipes Ltd is rated 'Sell' by MarketsMOJO, with this rating last updated on 09 Mar 2026. However, the analysis and financial metrics discussed below reflect the stock's current position as of 20 July 2026, providing investors with an up-to-date view of the company’s fundamentals, returns, and market performance.
Read full news article
Hi-Tech Pipes Ltd is Rated Sell
Hi-Tech Pipes Ltd is rated 'Sell' by MarketsMOJO, with this rating last updated on 09 March 2026. However, the analysis and financial metrics discussed here reflect the stock's current position as of 09 July 2026, providing investors with an up-to-date view of the company’s performance and outlook.
Read full news article Announcements
Compliances-Certificate under Reg. 74 (5) of SEBI (DP) Regulations 2018
10-Jul-2026 | Source : BSEHi-Tech Pipes Limited has submitted certificate under Reg. 74(5) of SEBI (DP) Regulations 2018 for the Quarter ended June 30 2026
Announcement under Regulation 30 (LODR)-Press Release / Media Release
03-Jul-2026 | Source : BSEHIGHEST EVER QUARTERLY SALES VOLUME
General Update
01-Jul-2026 | Source : BSEGeneral Update
Corporate Actions

No Upcoming Board Meetings

Hi-Tech Pipes Ltd has declared 2% dividend, ex-date: 19 Sep 25

Hi-Tech Pipes Ltd has announced 1:10 stock split, ex-date: 17 Mar 23

No Bonus history available

No Rights history available
Quality key factors
Valuation key factors
Technicals key factors
 Technical Indicator Scale: Bearish, Mildly Bearish, Sideways, Mildly Bullish, Bullish Turned
 Shareholding Snapshot : Jun 2026
Shareholding Compare (%holding)
Promoters
13.0004
Held by 4 Schemes (12.06%)
Held by 30 FIIs (1.05%)
Ajay Kumar Bansal (10.57%)
Bandhan Small Cap Fund (9.33%)
28.4%
Quarterly Results Snapshot (Consolidated) - Mar'26 - YoY

YoY Growth in quarter ended Mar 2026 is 101.76% vs 7.74% in Mar 2025

YoY Growth in quarter ended Mar 2026 is -0.17% vs 58.40% in Mar 2025
Half Yearly Results Snapshot (Consolidated) - Sep'25
Growth in half year ended Sep 2025 is 4.91% vs 13.31% in Sep 2024
Growth in half year ended Sep 2025 is 13.88% vs 95.67% in Sep 2024
Nine Monthly Results Snapshot (Consolidated) - Dec'25
YoY Growth in nine months ended Dec 2025 is 16.53% vs 15.64% in Dec 2024
YoY Growth in nine months ended Dec 2025 is 5.89% vs 68.58% in Dec 2024
Annual Results Snapshot (Consolidated) - Mar'26
YoY Growth in year ended Mar 2026 is 36.92% vs 13.65% in Mar 2025
YoY Growth in year ended Mar 2026 is 4.40% vs 66.06% in Mar 2025
About Hi-Tech Pipes Ltd

Company Coordinates


