
Compare Hi-Tech Pipes with Similar Stocks
Stock DNA
Iron & Steel Products
INR 1,855 Cr (Small Cap)
25.00
26
0.02%
0.14
5.71%
1.43
Total Returns (Price + Dividend) 
Latest dividend: 0.02 per share ex-dividend date: Sep-19-2025
Risk Adjusted Returns v/s
Returns Beta

News

Hi-Tech Pipes Ltd is Rated Sell by MarketsMOJO
Hi-Tech Pipes Ltd is rated 'Sell' by MarketsMOJO, with this rating last updated on 09 Mar 2026. However, the analysis and financial metrics discussed here reflect the company’s current position as of 17 June 2026, providing investors with an up-to-date view of the stock’s fundamentals, valuation, financial trends, and technical outlook.
Read full news article
Hi-Tech Pipes Ltd is Rated Sell by MarketsMOJO
Hi-Tech Pipes Ltd is rated 'Sell' by MarketsMOJO, with this rating last updated on 09 Mar 2026. While the rating change occurred in early March, the analysis and financial metrics discussed here reflect the stock's current position as of 08 June 2026, providing investors with an up-to-date view of the company’s fundamentals, valuation, financial trends, and technical outlook.
Read full news article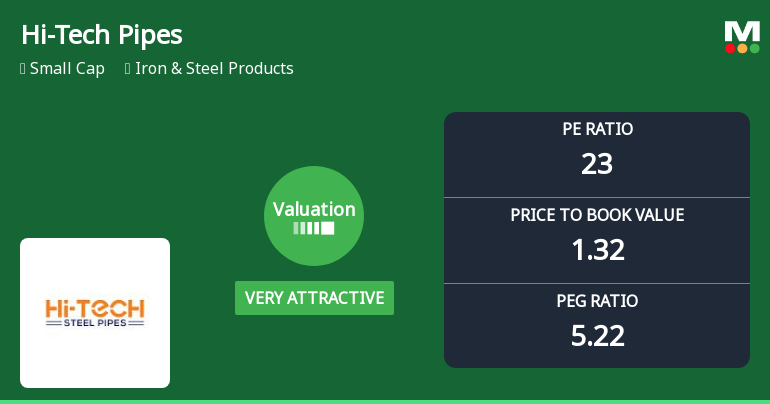
Hi-Tech Pipes Ltd Valuation Shifts to Very Attractive Amid Market Volatility
Hi-Tech Pipes Ltd, a small-cap player in the Iron & Steel Products sector, has seen a notable shift in its valuation parameters, moving from an attractive to a very attractive rating. Despite a recent sharp decline in share price, the company’s price-to-earnings (P/E) and price-to-book value (P/BV) ratios now present a compelling case for value-oriented investors, especially when compared with its peers and historical benchmarks.
Read full news article Announcements
Announcement under Regulation 30 (LODR)-Newspaper Publication
09-Jun-2026 | Source : BSEHi-Tech Pipes Limited has informed the Exchange about copy of Newspaper Publication
Corrigendum To The Notice Of Postal Ballot Dated May 28 2026
08-Jun-2026 | Source : BSEHi-Tech Pipes Limited has informed the Exchange regarding Corrigendum to Notice of Postal Ballot dated May 28 2026
Announcement under Regulation 30 (LODR)-Analyst / Investor Meet - Outcome
03-Jun-2026 | Source : BSETranscript of Earnings Conference Call held on May 28 2026 w.r.t. Financial Results for the Quarter and Year ended March 31 2026
Corporate Actions

No Upcoming Board Meetings

Hi-Tech Pipes Ltd has declared 2% dividend, ex-date: 19 Sep 25

Hi-Tech Pipes Ltd has announced 1:10 stock split, ex-date: 17 Mar 23

No Bonus history available

No Rights history available
Quality key factors
Valuation key factors
Technicals key factors
 Technical Indicator Scale: Bearish, Mildly Bearish, Sideways, Mildly Bullish, Bullish Turned
 Shareholding Snapshot : Mar 2026
Shareholding Compare (%holding)
Promoters
13.5642
Held by 4 Schemes (12.02%)
Held by 29 FIIs (0.81%)
Ajay Kumar Bansal (10.57%)
Bandhan Small Cap Fund (0%)
29.06%
Quarterly Results Snapshot (Consolidated) - Mar'26 - YoY

YoY Growth in quarter ended Mar 2026 is 101.76% vs 7.74% in Mar 2025

YoY Growth in quarter ended Mar 2026 is -0.17% vs 58.40% in Mar 2025
Half Yearly Results Snapshot (Consolidated) - Sep'25
Growth in half year ended Sep 2025 is 4.91% vs 13.31% in Sep 2024
Growth in half year ended Sep 2025 is 13.88% vs 95.67% in Sep 2024
Nine Monthly Results Snapshot (Consolidated) - Dec'25
YoY Growth in nine months ended Dec 2025 is 16.53% vs 15.64% in Dec 2024
YoY Growth in nine months ended Dec 2025 is 5.89% vs 68.58% in Dec 2024
Annual Results Snapshot (Consolidated) - Mar'26
YoY Growth in year ended Mar 2026 is 36.92% vs 13.65% in Mar 2025
YoY Growth in year ended Mar 2026 is 4.40% vs 66.06% in Mar 2025
About Hi-Tech Pipes Ltd

Company Coordinates


