
Compare Elitecon Inter. with Similar Stocks
Dashboard
With ROCE of 9.5, it has a Very Expensive valuation with a 6.4 Enterprise value to Capital Employed
- The stock is trading at a premium compared to its peers' average historical valuations
- Over the past year, while the stock has generated a return of -63.98%, its profits have fallen by 0%
Below par performance in long term as well as near term
Stock DNA
Trading & Distributors
INR 4,263 Cr (Small Cap)
13.00
23
0.19%
1.06
20.14%
12.38
Total Returns (Price + Dividend) 
Latest dividend: 0.05 per share ex-dividend date: Nov-12-2025
Risk Adjusted Returns v/s
Returns Beta

News
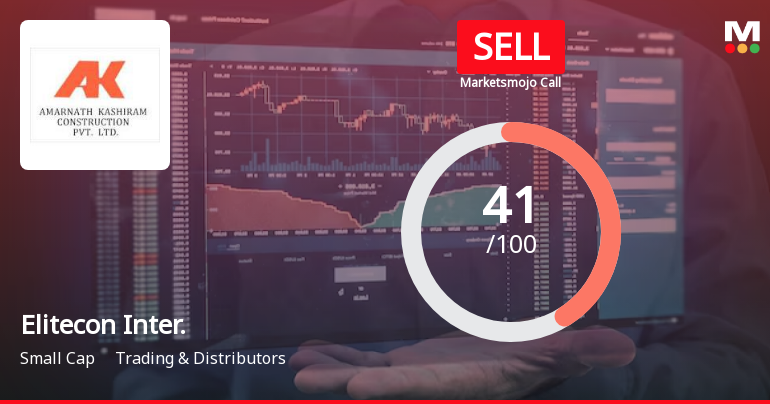
Elitecon International Ltd is Rated Sell
Elitecon International Ltd is rated 'Sell' by MarketsMOJO, with this rating last updated on 31 Dec 2025. However, the analysis and financial metrics discussed here reflect the stock's current position as of 05 July 2026, providing investors with an up-to-date view of its performance and outlook.
Read full news article
Elitecon International Ltd is Rated Sell
Elitecon International Ltd is rated Sell by MarketsMOJO. This rating was last updated on 31 December 2025. However, the analysis and financial metrics discussed here reflect the stock’s current position as of 24 June 2026, providing investors with the latest insights into the company’s performance and outlook.
Read full news article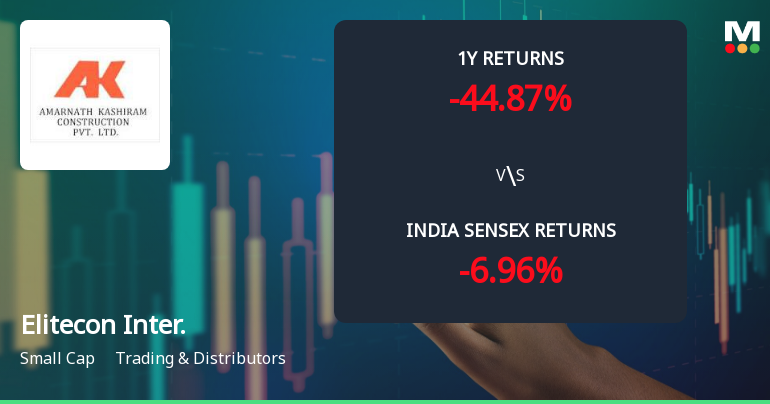
Elitecon International Ltd Faces Bearish Momentum Amid Technical Deterioration
Elitecon International Ltd, a small-cap player in the Trading & Distributors sector, has seen a marked deterioration in its technical indicators, signalling a shift towards bearish momentum. With a recent downgrade from Hold to Sell and a significant year-to-date price decline, the stock’s technical profile warrants close scrutiny for investors navigating volatile market conditions.
Read full news article Announcements
Closure of Trading Window
28-Jun-2026 | Source : BSEClosure of Trading Window for the Quarter Ended June 30 2026.
Clarification Regarding Delay In Submission Of Audited Financial Results For The Quarter And Financial Year Ended March 31 2026
16-Jun-2026 | Source : BSEClarification with reference to the earlier intimation dated June 11 2026 regarding delay in submission of Audited Financial Results.
Closure of Trading Window
12-Jun-2026 | Source : BSEIntimation regarding closure of trading window for the quarter and financial year ended March 31 2026 in continuation of the Companys earlier intimation dated March 24 2026.
Corporate Actions

No Upcoming Board Meetings

Elitecon International Ltd has declared 5% dividend, ex-date: 12 Nov 25

Elitecon International Ltd has announced 1:10 stock split, ex-date: 25 Jun 25

No Bonus history available

No Rights history available
Quality key factors
Valuation key factors
Technicals key factors
 Technical Indicator Scale: Bearish, Mildly Bearish, Sideways, Mildly Bullish, Bullish Turned
 Shareholding Snapshot : Mar 2026
Shareholding Compare (%holding)
Promoters
None
Held by 0 Schemes
Held by 18 FIIs (38.04%)
Pandokhar Food Llp (24.71%)
Minerva Ventures Fund (8.67%)
2.07%
Quarterly Results Snapshot (Standalone) - Dec'25 - YoY

YoY Growth in quarter ended Dec 2025 is 938.70% vs 392.37% in Dec 2024

YoY Growth in quarter ended Dec 2025 is 44.11% vs 2,858.33% in Dec 2024
Half Yearly Results Snapshot (Consolidated) - Sep'25
Not Applicable: The company has declared_date for only one period
Not Applicable: The company has declared_date for only one period
Nine Monthly Results Snapshot (Consolidated) - Dec'25
Not Applicable: The company has declared_date for only one period
Not Applicable: The company has declared_date for only one period
Annual Results Snapshot (Consolidated) - Mar'25
Not Applicable: The company has declared_date for only one period
Not Applicable: The company has declared_date for only one period
About Elitecon International Ltd

Company Coordinates


