
Compare Redington with Similar Stocks
Dashboard
Strong Long Term Fundamental Strength with a 16.50% CAGR growth in Net Sales
- Strong ability to service debt as the company has a low Debt to EBITDA ratio of 1.27 times
- The company has been able to generate a Return on Capital Employed (avg) of 26.71% signifying high profitability per unit of total capital (equity and debt)
The company has declared Positive results for the last 3 consecutive quarters
With ROCE of 17, it has a Fair valuation with a 2.3 Enterprise value to Capital Employed
High Institutional Holdings at 78.39%
Market Beating performance in long term as well as near term
Stock DNA
Trading & Distributors
INR 26,561 Cr (Small Cap)
14.00
15
1.87%
0.17
15.76%
2.47
Total Returns (Price + Dividend) 
Latest dividend: 6 per share ex-dividend date: Jul-03-2026
Risk Adjusted Returns v/s
Returns Beta

News
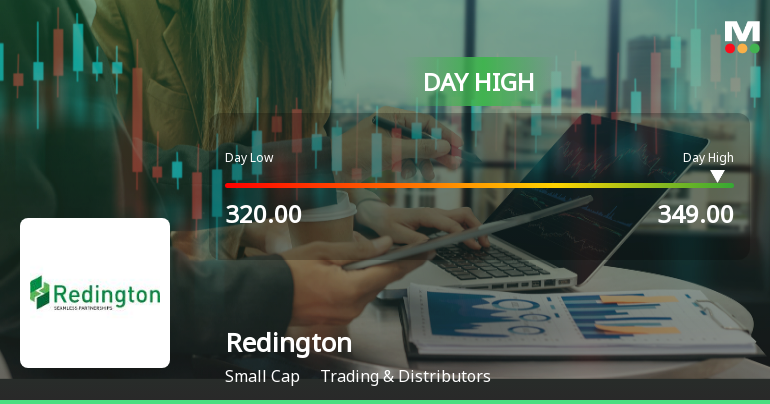
Redington Ltd Surges 7.41% to Day's High of Rs 346.2 — Outperforms Sector by 2.07 Percentage Points
The Sensex gained 0.79% on 3 Aug 2026, but Redington Ltd outpaced the broader market with a 7.41% surge, touching an intraday high of Rs 346.2. This 2.07 percentage-point outperformance over the IT - Hardware sector’s 4.81% gain highlights a distinctly stock-specific rally rather than a mere market tailwind.
Read full news article
Redington Ltd Sees Robust Trading Activity Amid Volatile Market Conditions
Redington Ltd, a prominent player in the Trading & Distributors sector, has witnessed significant trading activity with a remarkable surge in value turnover and institutional participation. The stock’s recent performance, coupled with an upgraded MarketsMOJO rating to Strong Buy, highlights growing investor confidence despite sector headwinds.
Read full news article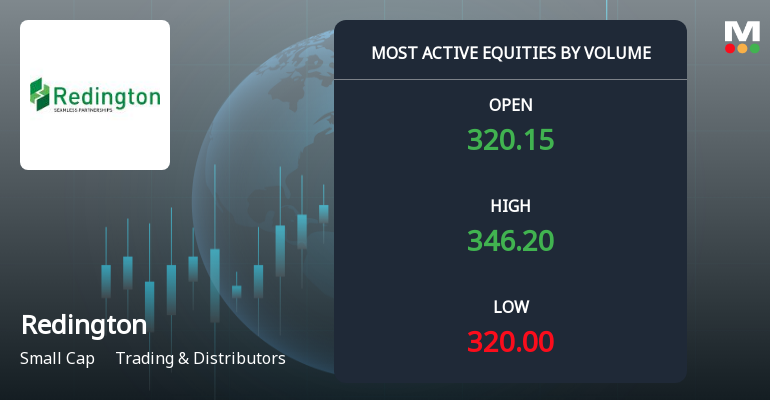
Redington Ltd Sees Exceptional Volume Surge Amid Volatile Trading
Redington Ltd, a prominent player in the Trading & Distributors sector, witnessed extraordinary trading volumes on 3 Aug 2026, marking it as one of the most actively traded stocks by volume. Despite a volatile session and an opening gap down, the stock demonstrated resilience with a notable intraday recovery, signalling strong investor interest and accumulation.
Read full news article Announcements
Redington (India) Limited - Dividend
21-Nov-2019 | Source : NSERedington (India) Limited has informed the Exchange that Board of Directors at its meeting held on November 21, 2019, declared Interim Dividend of Rs. 1.5 per equity share.
Redington (India) Limited - Trading Window
15-Nov-2019 | Source : NSERedington (India) Limited has informed the Exchange regarding the Trading Window closure pursuant to SEBI (Prohibition of Insider Trading) Regulations, 2015
Redington (India) Limited - Investor Presentation
06-Nov-2019 | Source : NSERedington (India) Limited has informed the Exchange regarding Investor Presentation
Corporate Actions

No Upcoming Board Meetings

Redington Ltd has declared 300% dividend, ex-date: 03 Jul 26

Redington Ltd has announced 2:10 stock split, ex-date: 20 Aug 10

Redington Ltd has announced 1:1 bonus issue, ex-date: 18 Aug 21

No Rights history available
Quality key factors
Valuation key factors
Technicals key factors
 Technical Indicator Scale: Bearish, Mildly Bearish, Sideways, Mildly Bullish, Bullish Turned
 Shareholding Snapshot : Jun 2026
Shareholding Compare (%holding)
FIIs
None
Held by 28 Schemes (10.96%)
Held by 279 FIIs (61.96%)
None
Synnex Technology International Corporation (24.12%)
16.32%
Quarterly Results Snapshot (Consolidated) - Jun'26 - QoQ

QoQ Growth in quarter ended Jun 2026 is 5.15% vs 7.41% in Mar 2026

QoQ Growth in quarter ended Jun 2026 is 24.19% vs -10.21% in Mar 2026
Half Yearly Results Snapshot (Consolidated) - Sep'25
Growth in half year ended Sep 2025 is 19.16% vs 6.38% in Sep 2024
Growth in half year ended Sep 2025 is 23.04% vs -2.42% in Sep 2024
Nine Monthly Results Snapshot (Consolidated) - Dec'25
YoY Growth in nine months ended Dec 2025 is 17.91% vs 8.94% in Dec 2024
YoY Growth in nine months ended Dec 2025 is 17.00% vs 5.17% in Dec 2024
Annual Results Snapshot (Consolidated) - Mar'26
YoY Growth in year ended Mar 2026 is 19.96% vs 11.18% in Mar 2025
YoY Growth in year ended Mar 2026 is -7.14% vs 31.69% in Mar 2025
About Redington Ltd

Company Coordinates


