
Compare Mahanagar Gas with Similar Stocks
Dashboard
High Management Efficiency with a high ROE of 15.42%
The company is Net-Debt Free
Poor long term growth as Operating profit has grown by an annual rate -18.49% of over the last 5 years
Negative results in Mar 26
With ROE of 13.1, it has a Fair valuation with a 1.9 Price to Book Value
High Institutional Holdings at 55.15%
Underperformed the market in the last 1 year
Total Returns (Price + Dividend) 
Latest dividend: 12.014092140921408 per share ex-dividend date: Feb-13-2026
Risk Adjusted Returns v/s
Returns Beta

News

Mahanagar Gas Ltd. Upgraded to Hold by MarketsMOJO Amid Mixed Financial and Technical Signals
Mahanagar Gas Ltd. has seen its investment rating upgraded from Sell to Hold, reflecting a nuanced shift in its technical outlook amid ongoing financial headwinds. The upgrade, effective from 22 June 2026, is driven primarily by improved technical indicators, while valuation and financial trends present a mixed picture. This article analyses the four key parameters—Quality, Valuation, Financial Trend, and Technicals—that influenced this rating change.
Read full news article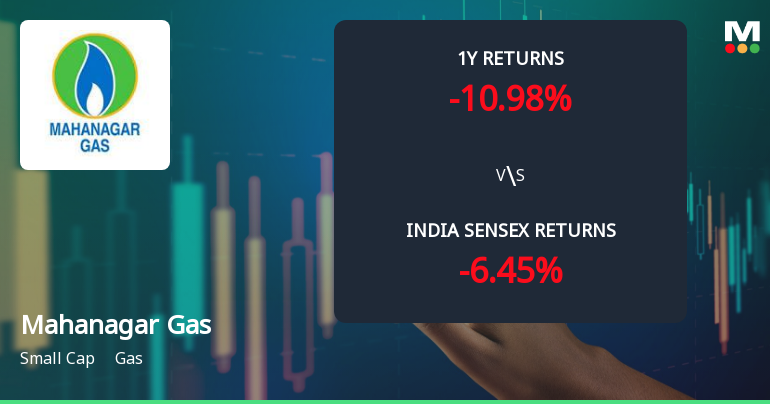
Mahanagar Gas Ltd. Technical Momentum Shifts Signal Mild Bullish Outlook
Mahanagar Gas Ltd. has exhibited a notable shift in its technical momentum, moving from a sideways trend to a mildly bullish stance. This change is underscored by mixed signals from key technical indicators such as MACD, RSI, Bollinger Bands, and moving averages, reflecting a nuanced outlook for investors amid recent price gains and sector dynamics.
Read full news article
Mahanagar Gas Ltd. Technical Momentum Shifts Amid Mixed Market Signals
Mahanagar Gas Ltd. has experienced a notable shift in its technical momentum, moving from a mildly bearish stance to a sideways trend as of June 2026. Despite a modest day decline of 0.26%, the stock’s technical indicators present a complex picture, with weekly signals showing mild bullishness contrasting with monthly bearish tendencies. This nuanced technical landscape warrants a detailed analysis for investors seeking clarity on the stock’s near-term trajectory.
Read full news article Announcements
Announcement under Regulation 30 (LODR)-Analyst / Investor Meet - Intimation
09-Jun-2026 | Source : BSEAnalyst / Investor Meeting is scheduled to be held on Monday June 15 2026
Announcement under Regulation 30 (LODR)-Change in Management
31-May-2026 | Source : BSEChange in Senior Management Personnel of the Company
Shareholder Meeting / Postal Ballot-Scrutinizers Report
20-May-2026 | Source : BSEDeclaration of Voting Results of Postal Ballot and Scrutinizers Report
Corporate Actions

No Upcoming Board Meetings

Mahanagar Gas Ltd. has declared 120% dividend, ex-date: 13 Feb 26

No Splits history available

No Bonus history available

No Rights history available
Quality key factors
Valuation key factors
Technicals key factors
 Technical Indicator Scale: Bearish, Mildly Bearish, Sideways, Mildly Bullish, Bullish Turned
 Shareholding Snapshot : Mar 2026
Shareholding Compare (%holding)
Promoters
None
Held by 25 Schemes (8.82%)
Held by 220 FIIs (24.14%)
Gail (india) Limited (32.5%)
Governor Of Maharashtra (10%)
10.43%
Quarterly Results Snapshot (Consolidated) - Mar'26 - YoY

YoY Growth in quarter ended Mar 2026 is 4.46% vs 21.81% in Mar 2025
YoY Growth in quarter ended Mar 2026 is -47.40% vs -5.20% in Mar 2025
Half Yearly Results Snapshot (Consolidated) - Sep'25

Growth in half year ended Sep 2025 is 19.74% vs 11.04% in Sep 2024
Growth in half year ended Sep 2025 is -11.44% vs -18.52% in Sep 2024
Nine Monthly Results Snapshot (Consolidated) - Dec'25
YoY Growth in nine months ended Dec 2025 is 16.87% vs 13.30% in Dec 2024
YoY Growth in nine months ended Dec 2025 is -10.79% vs -22.16% in Dec 2024
Annual Results Snapshot (Consolidated) - Mar'26
YoY Growth in year ended Mar 2026 is 13.52% vs 15.48% in Mar 2025
YoY Growth in year ended Mar 2026 is -19.14% vs -19.03% in Mar 2025
About Mahanagar Gas Ltd.

Company Coordinates


